Utah Statewide Wellbeing Survey Report
By Dr. Courtney Flint and Team
![]()
courtney.flint@usu.edu
435-797-8635
Summary
The Utah Wellbeing Survey project is designed to assess the wellbeing and local perspectives of city residents, and to provide information to city leaders to inform their general planning processes. Questions include rating and importance of ten different domains or categories of wellbeing, participation in recreation and nature-related activities, perspectives on local population growth and economic development, the influence of landscape features on wellbeing, concerns for the future, and an array of demographic characteristic questions. Some cities added additional questions to their survey, particularly regarding housing and city amenities.
How was the survey conducted?
In early 2022, 33 cities participated in the Utah Wellbeing Survey. The survey for each city was available online through Qualtrics for at least three weeks. Each participating city advertised the survey via social media, newsletters, utility bills, websites, flyers, local news media or other local mechanisms. All residents in the participating cities age 18+ were encouraged to take the survey.
How many people responded?
A total of 9,947 completed surveys were recorded during this 2022 effort, bringing the total number of surveys completed for the Utah Wellbeing Project since 2019 up to 24,356.
Additional Information
Reports summarizing city-specific results from the survey may be found on the Utah Wellbeing Project Website. This information may help cities refine their messaging with residents on key issues, affirm existing plans, support future planning, and have practical implications for spending and providing services.
This project benefits from the partnership with the Utah League of Cities and Towns, which is helping cities envision ways to use the findings from the wellbeing survey to inform their general planning processes.
Survey Cities and Responses
This effort builds upon previous survey efforts in 2019, 2020, and 2021. The map below highlights the cities participating in the survey project over time. The surveyed cities fall into three combined clusters according to the Utah League of Cities and Towns. The varying levels of responses correspond to confidence intervals from 3.24 to 14.27%.
Note: Monticello and Wellington also participated in the 2022 Utah Wellbeing Project Surveys. However, too few responses were collected for them to be included in the comparative analysis.
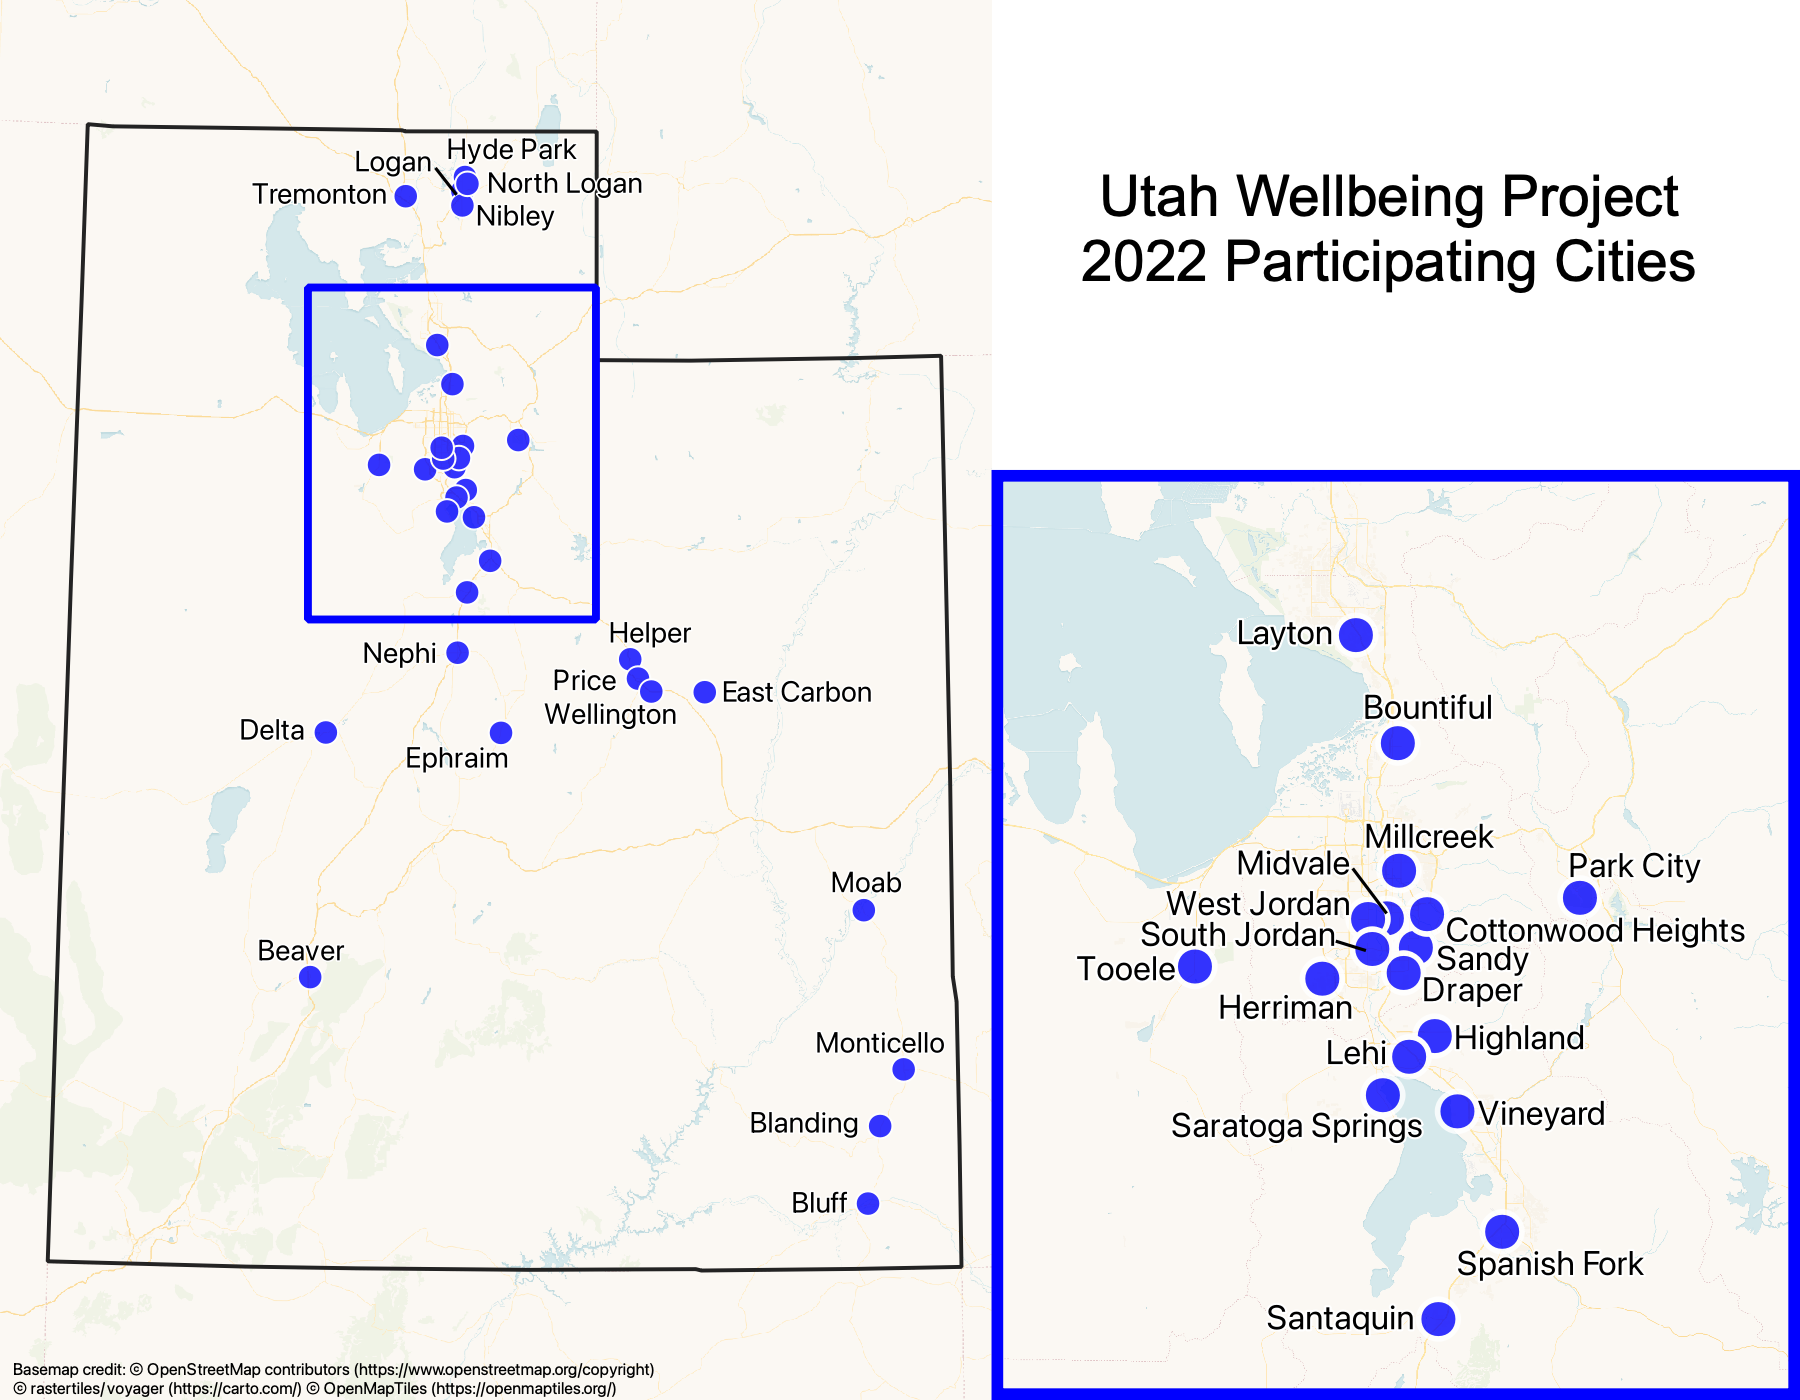
City Clusters for Surveyed Cities and Number of 2022 Survey Responses
Cities of the 1st and 2nd Class & Established/Mid-Sized Cities
Bountiful (270)
Cottonwood Heights (227)
Draper (888)
Layton (319)
Logan (476)
Midvale (52)
Millcreek (274)
Sandy (809)
South Jordan (467)
Tooele (322)
West Jordan (672)
Rapid Growth Cities
Herriman (136)
Highland (187)
Hyde Park (448)
Lehi (245)
Nibley (457)
North Logan (299)
Santaquin (50)
Saratoga Springs (109)
Spanish Fork (595)
Vineyard (418)
Rural Hub/Resort & Traditional Rural Communities
Beaver (131)
Blanding (207)
Bluff (83)
Delta (77)
East Carbon (131)
Ephraim (106)
Helper (46)
Moab (208)
Nephi (250)
Park City (390)
Price (261)
Tremonton (418)
Survey Respondent Characteristics
The survey respondents come from 33 cities in Utah. They were not selected to be fully representative of the state of Utah. Nevertheless, they do provide insights into statewide experiences of wellbeing and beyond. The table below compares the demographic characteristics of the survey respondents from all 33 cities with the Utah census information. People age 18-29, males, Hispanics/Latinos, nonwhites and those with household incomes under $25,000 were underrepresented in the survey sample. People with a college degree, those who are married, those with household incomes over $150,000, and those who own their home were overrepresented in the survey sample. Weighting was not used in any of the analysis for the findings presented below.
Table 1
Demographic Characteristics of Survey Respondents and U.S. Census Data for Utah
Demographic Characteristics |
Statewide Wellbeing Survey | American Community Survey 2016-2020 Estimates |
|---|---|---|
| Online 2022 9947 Respondents |
||
| Age 18-29 | 8.0% | 26.9% |
| Age 30-39 | 22.7% | 20.3% |
| Age 40-49 | 25.0% | 16.9% |
| Age 50-59 | 17.7% | 13.6% |
| Age 60-69 | 15.5% | 12.0% |
| Age 70 or over | 11.0% | 10.3% |
| Adult Female | 64.3% | 50.1% |
| Adult Male | 35.0% | 49.9% |
| Adult non-conforming or non-binary |
0.7% | NA |
| No college degree | 38.0% | 65.3% |
| College degree (4-year) | 62.0% | 34.7% |
| Median household income | NA | $74,197 |
| Income under $25,000 | 3.6% | 12.4% |
| Income $25,000 to $49,999 | 9.8% | 19.0% |
| Income $50,000 to $74,999 | 14.8% | 19.2% |
| Income $75,000 to $99,999 | 18.1% | 15.4% |
| Income $100,000 to $149,999 | 27.5% | 19.2% |
| Income $150,000 or over | 26.2% | 14.7% |
| Church of Jesus Christ of Latter-day Saints | 56.2% | NA |
| Other religion | 17.7% | NA |
| Agnostic/Atheist/No religious preference | 26.2% | NA |
| Hispanic/Latino | 4.8% | 14.7% |
| White | 94.3% | 85.2% |
| Nonwhite | 5.7% | 14.8% |
| Married | 82.2% | 55.8% |
| Children under 18 in household | 49.5% | 39.9% |
| Employed | 66.5% | 66.1% |
| Out of work and looking for work | 0.6% | 2.5% |
| Other | 32.9% | 31.2% |
| Own home/Owner occupied | 89.7% | 70.5% |
| Rent home/Renter occupied/Other | 10.3% | 29.5% |
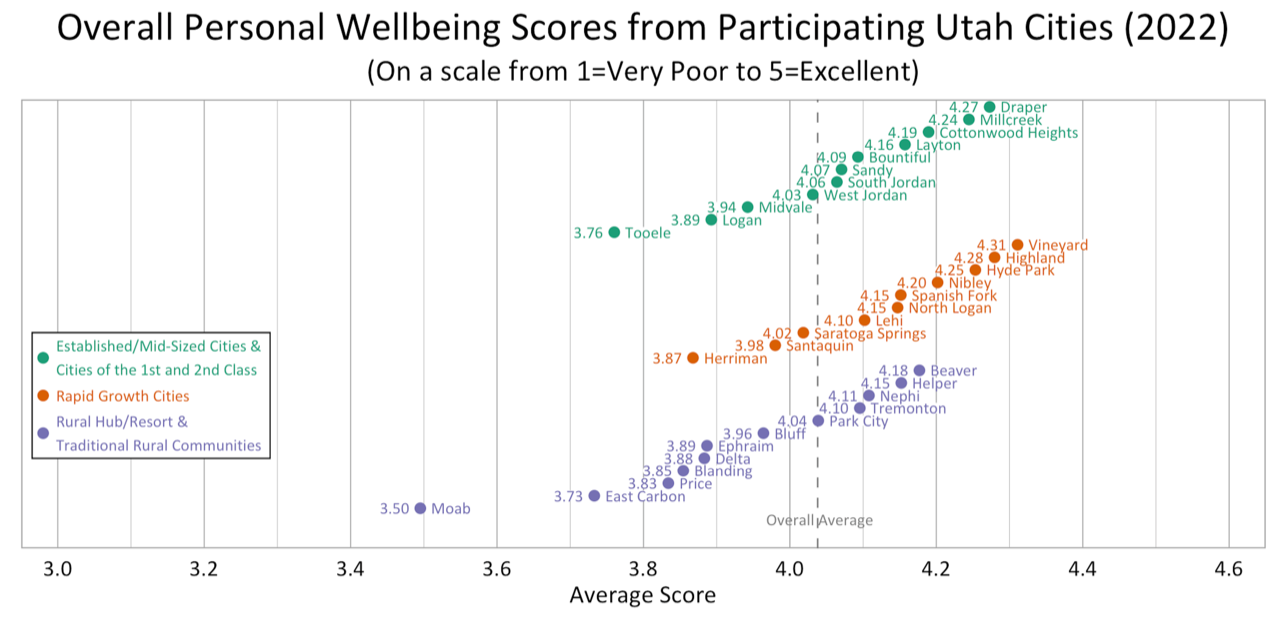
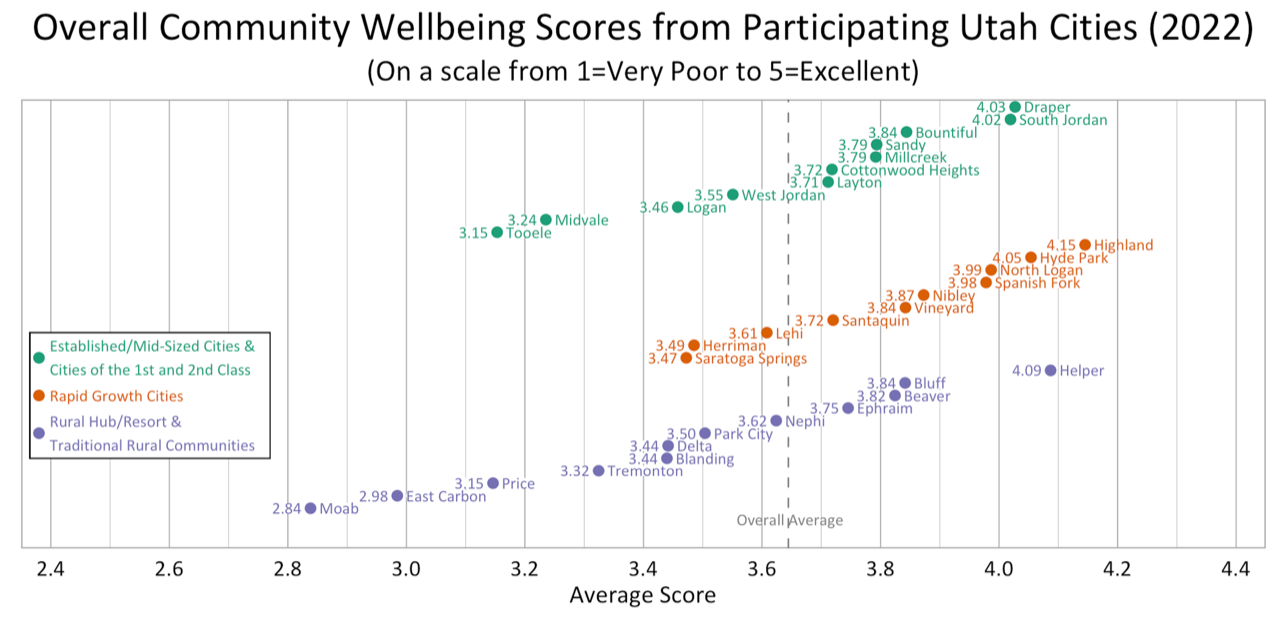
Overall Personal Wellbeing and Community Wellbeing in Cities
The average overall personal wellbeing score for all surveyed Utahns was 4.13 on a scale from 1 (Very Poor) to 5 (Excellent). The average overall community wellbeing score for all surveyed Utahns was 3.65. The figures below show the city scores for overall personal wellbeing and community wellbeing within their cluster type. Scores for overall personal and community wellbeing were lower for Rural, Rural Hub and Resort Cities (average 3.94 and 3.55) than for Rapid Growth Cities (average 4.03 and 3.65) and Cities of the 1st and 2nd Class and Established/Mid-sized Cities (average 4.06 and 3.60). These scores have been weighted by population and sample size, but not by demographics.
Wellbeing Domains
The survey asked respondents to rate their wellbeing for ten domains and indicate the importance of these domains to their overall wellbeing. The matrix graph below shows the relationship between the ratings and the importance of the ten wellbeing domains for the combined and unweighted statewide data. These variables were measured on 5-point scales. For all Utahns surveyed in 2022, the highest rated domains were Living Standards, Safety and Security, and Education. The most important domains were Safety and Security, Mental Health, and Physical Health. No domains fell in the “red zone” quadrant for higher importance and lower than average ratings, however, Local Environmental Quality, Leisure Time, and Physical Health approached this zone. The city matrix graphs varied considerably, and the domain scores also varied across demographic groups. This graph has not been weighted by population, sample size or demographics.
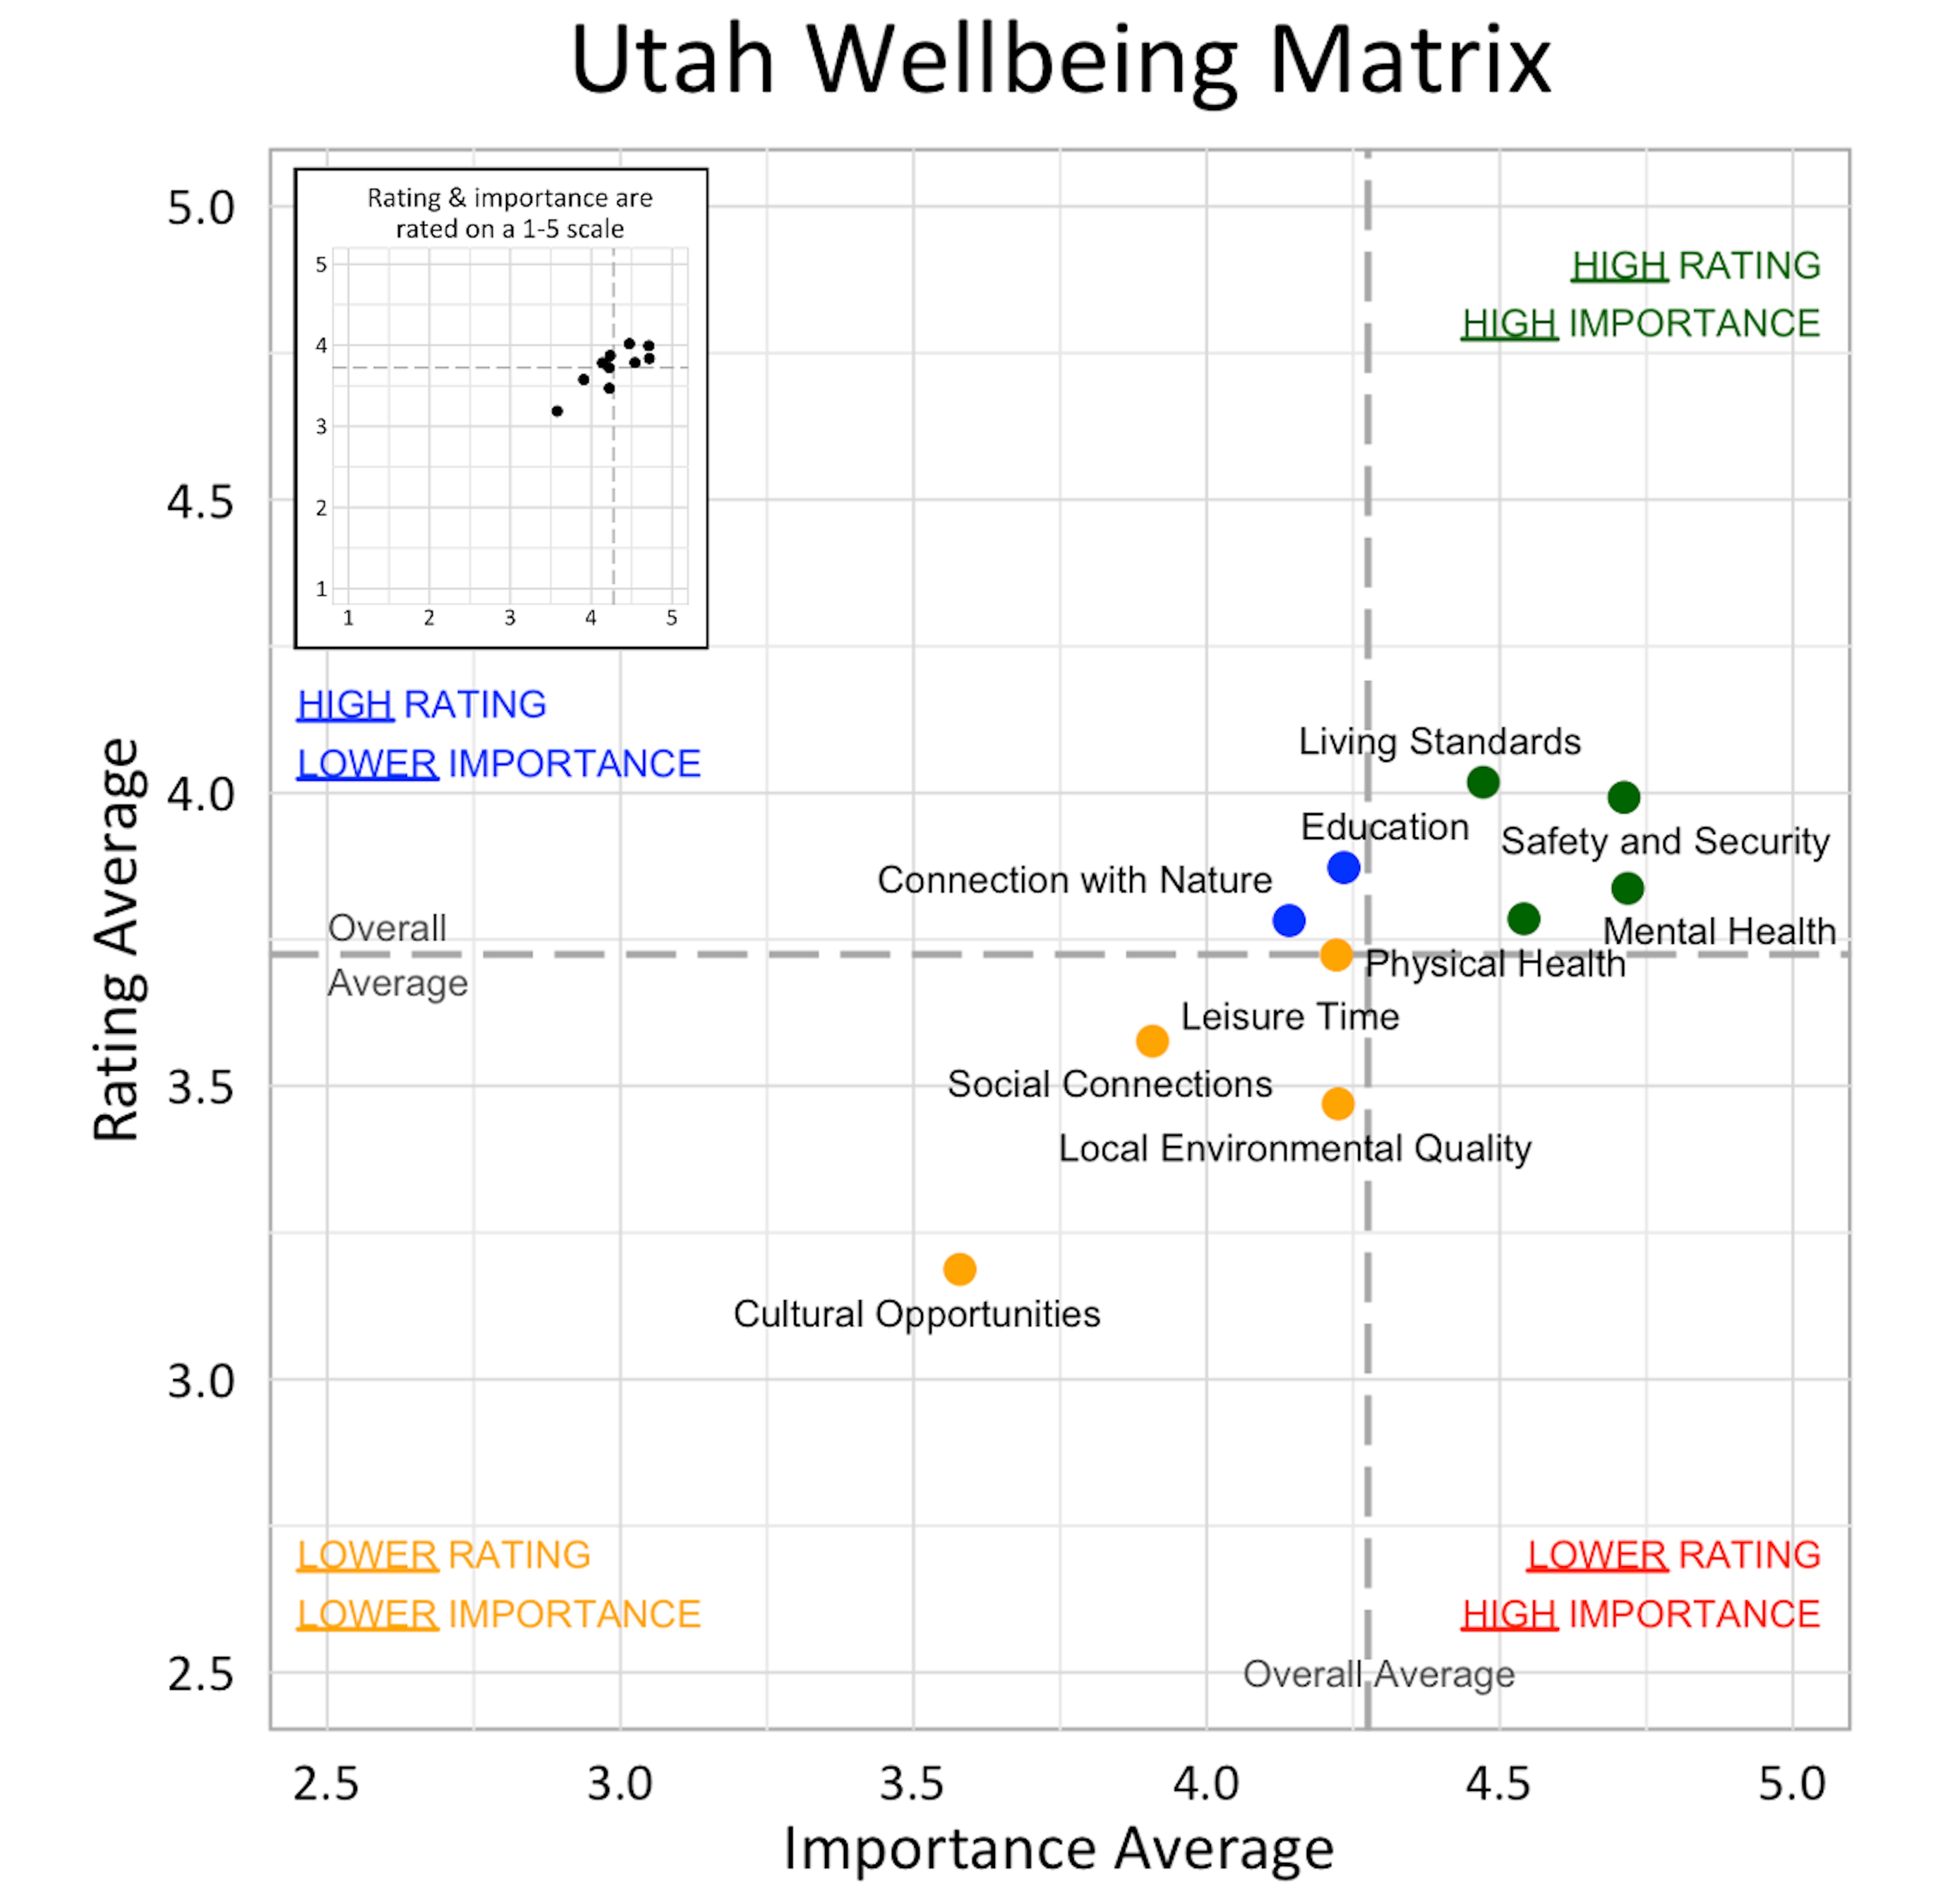
Table 2
Red Zone Domains for Study Cities (Domains with High Importance Scores and Lower Ratings)
| Physical Health |
Local Environmental Quality |
Mental Health |
Living Standards | Leisure Time | Safety and Security | Education | None | ||||
|
Beaver Bluff East Carbon Helper Hyde Park |
North Logan |
Cottonwood Heights East Carbon Layton Moab Park City |
Blanding Bluff Delta Ephraim |
Blanding |
Herriman Price Sanatquin |
East Carbon Midvale Millcreek |
Beaver Blanding Delta Nephi |
Bountiful Lehi Logan Sandy Tremonton Vineyard West Jordan |
|||
How are Demographic Characteristics Related to Wellbeing?
The demographic variables age, gender, college degree, religion, income, length of residence, city cluster type, children in household, and marital status were found to have varying relationships with wellbeing perspectives among respondents as shown in the table below based on a generalized linear model with unweighted data (p < .05). The +/- sign indicates whether the wellbeing score in the specific demographic group was significantly higher or lower than the other group(s) in each demographic variable.
Table 3
Relationship Between Demographic Characteristics and Wellbeing Domains in Utah
| Domains Rated | Demographic Variables | ||||||||
|---|---|---|---|---|---|---|---|---|---|
| Age 60+ | Female | College Degree | Latter-day Saint | Highest Income ($150,000+) | Resident 5 Years or Less | Urban | Children in Household | Married | |
| Wellbeing Ratings | |||||||||
| Overall Personal Wellbeing | + | + | + | + | – vs RG + vs Rural |
+ | |||
| Wellbeing in Beaver | + | + | + | + | + | – vs RG + vs Rural |
– | + | |
| Connection with Nature | + | + | + | – | – | ||||
| Cultural Opportunities | + | + | + | + | – | + | |||
| Education | + | + | + | + | + | – vs RG + vs Rural |
– | + | |
| Leisure Time | + | + | + | + | – vs RG | – | + | ||
| Living Standards | + | + | + | + | + | – vs RG + vs Rural |
+ | ||
| Local Environmental Quality | + | – | + | + | + | + | – | ||
| Mental Health | + | – | + | + | + | – vs RG | + | ||
| Physical Health | + | + | + | ||||||
| Safety & Security | + | + | + | + | + | – | – | + | |
| Social Connections | + | + | + | + | + | – | – vs RG | + | |
| Age 60+ | Female | College Degree | Latter-day Saint | Highest Income ($150,000+) | Resident 5 Years or Less | Urban | Children in Household | Married | |
| Domains | Domain Importance | ||||||||
| Connection with Nature | + vs 18-39 | + | + | – | + vs $75,000- $99,999 | – vs Rural | – | ||
| Cultural Opportunities | + | + | + | – | – vs Under $75,000 | – vs RG | |||
| Education | + | + | + | – | + vs Rural | + | + | ||
| Leisure Time | – | – | + | – vs Rural | – | + | |||
| Living Standards | + | + vs A/A/NRP | + | – vs RG | |||||
| Local Environmental Quality | + | + | + | – | + vs Under $75,000- $99,999 | – | |||
| Mental Health | + | + |
+ | + | + vs Rural | ||||
| Physical Health | + | + | + | + | + | – | + | ||
| Safety and Security | + |
+ |
+ |
+ vs Under $75,000- $99,999 | + vs Rural |
+ | + | ||
| Social Connections | + | + | + | + vs A/A/NRP | + | – | |||
Urban= Cities of the 1st and 2nd class
RG= Rapid Growth Cities
Participation in Recreation and Nature-Related Activities
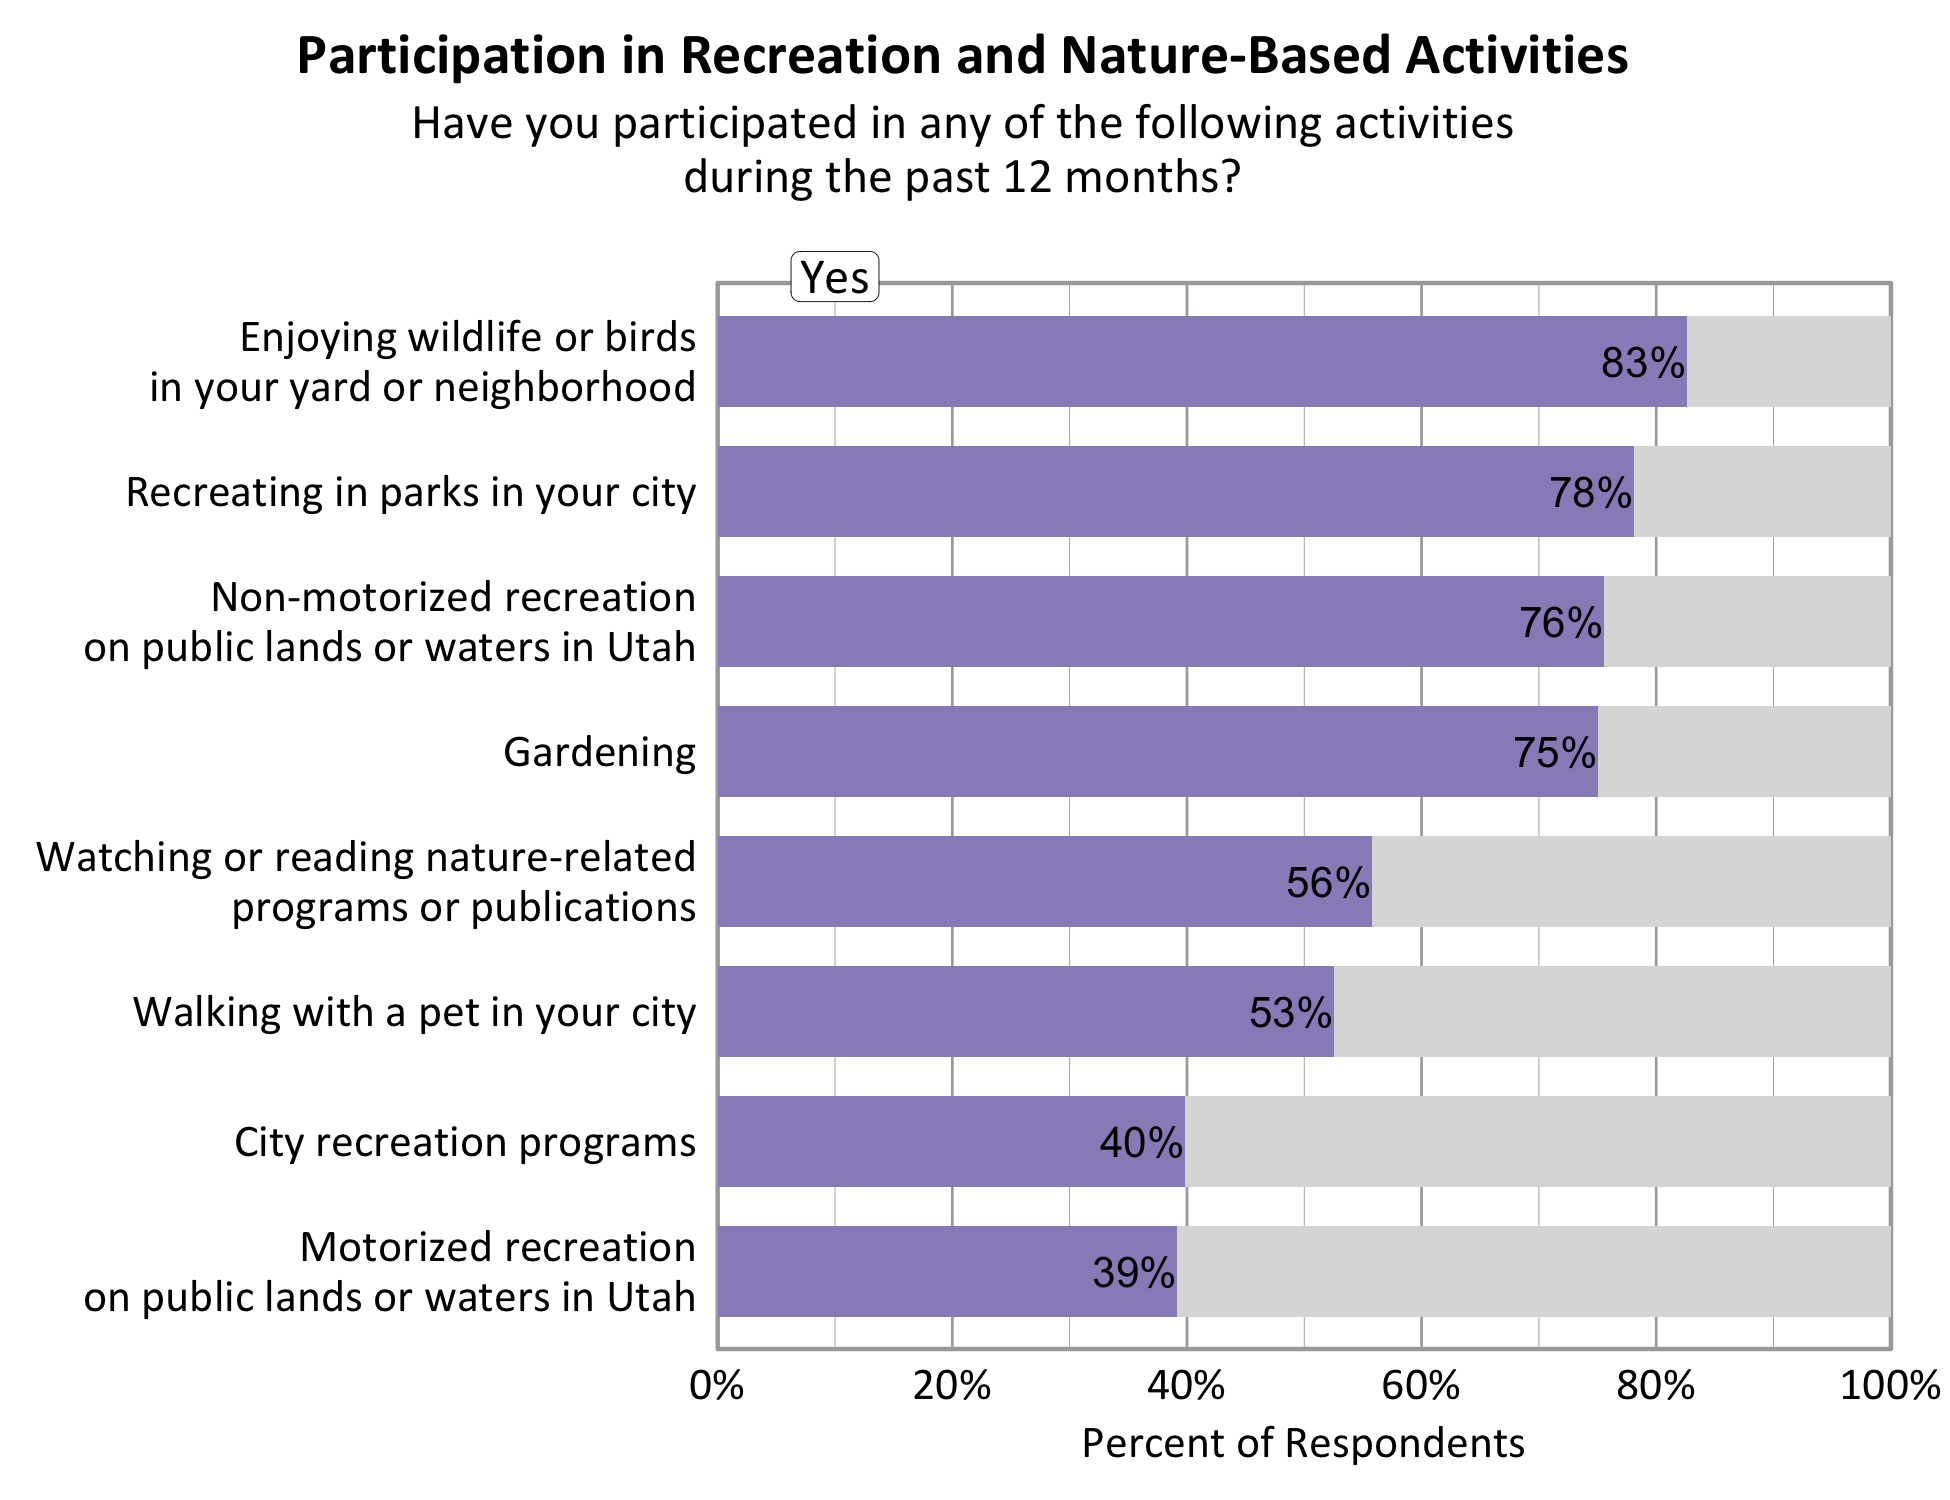
Respondents in each participating city were asked to indicate whether or not they participated in eight different recreation or nature-based activities in the past 12 months. Enjoying wildlife and birds in your yard or neighborhood (83%) and recreating in parks in the city (78%) were the most common activities for all respondents, followed by non-motorized recreation on public lands or waters (76%) and gardening (75%).
Community Connectedness
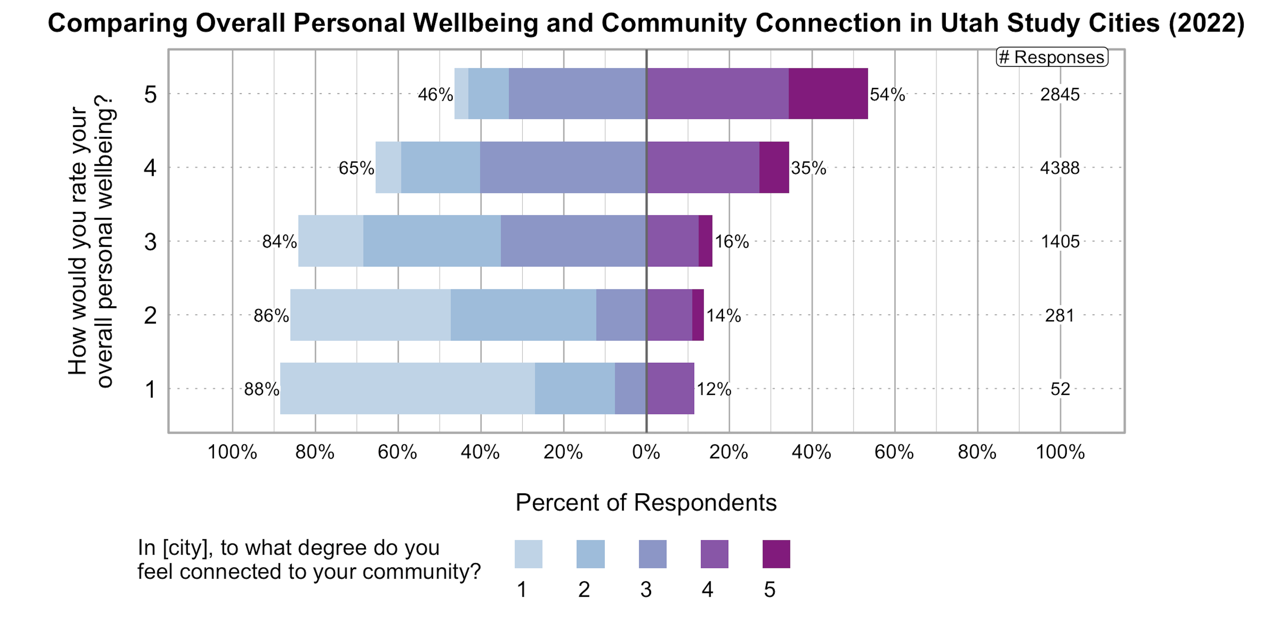
The survey asked, “In [city], to what degree do you feel connected to your community?” and ‘In [city], to what degree do people take action together in response to local problems or opportunities” on 5-point scales. Community connectedness and perceptions of local action were higher for respondents from the Traditional Rural, Rural Hub, and Resort Cities (3.31 and 3.44 respectively) than Rapid Growth Cities (2.91 and 3.03) and Cities of the 1st and 2nd Class and Established/Mid-Sized Cities (2.91 and 2.93).


Across the state, those with higher levels of community connectedness reported higher levels of personal wellbeing. This relationship has not been weighted by city population, city sample proportion, or demographic variables.
Landscapes and Wellbeing
The survey asked respondents to rate the influence of various landscape features on their wellbeing. As the graph shows below, natural landscapes had a predominantly positive influence on wellbeing, while respondents were more divided about development and industry.
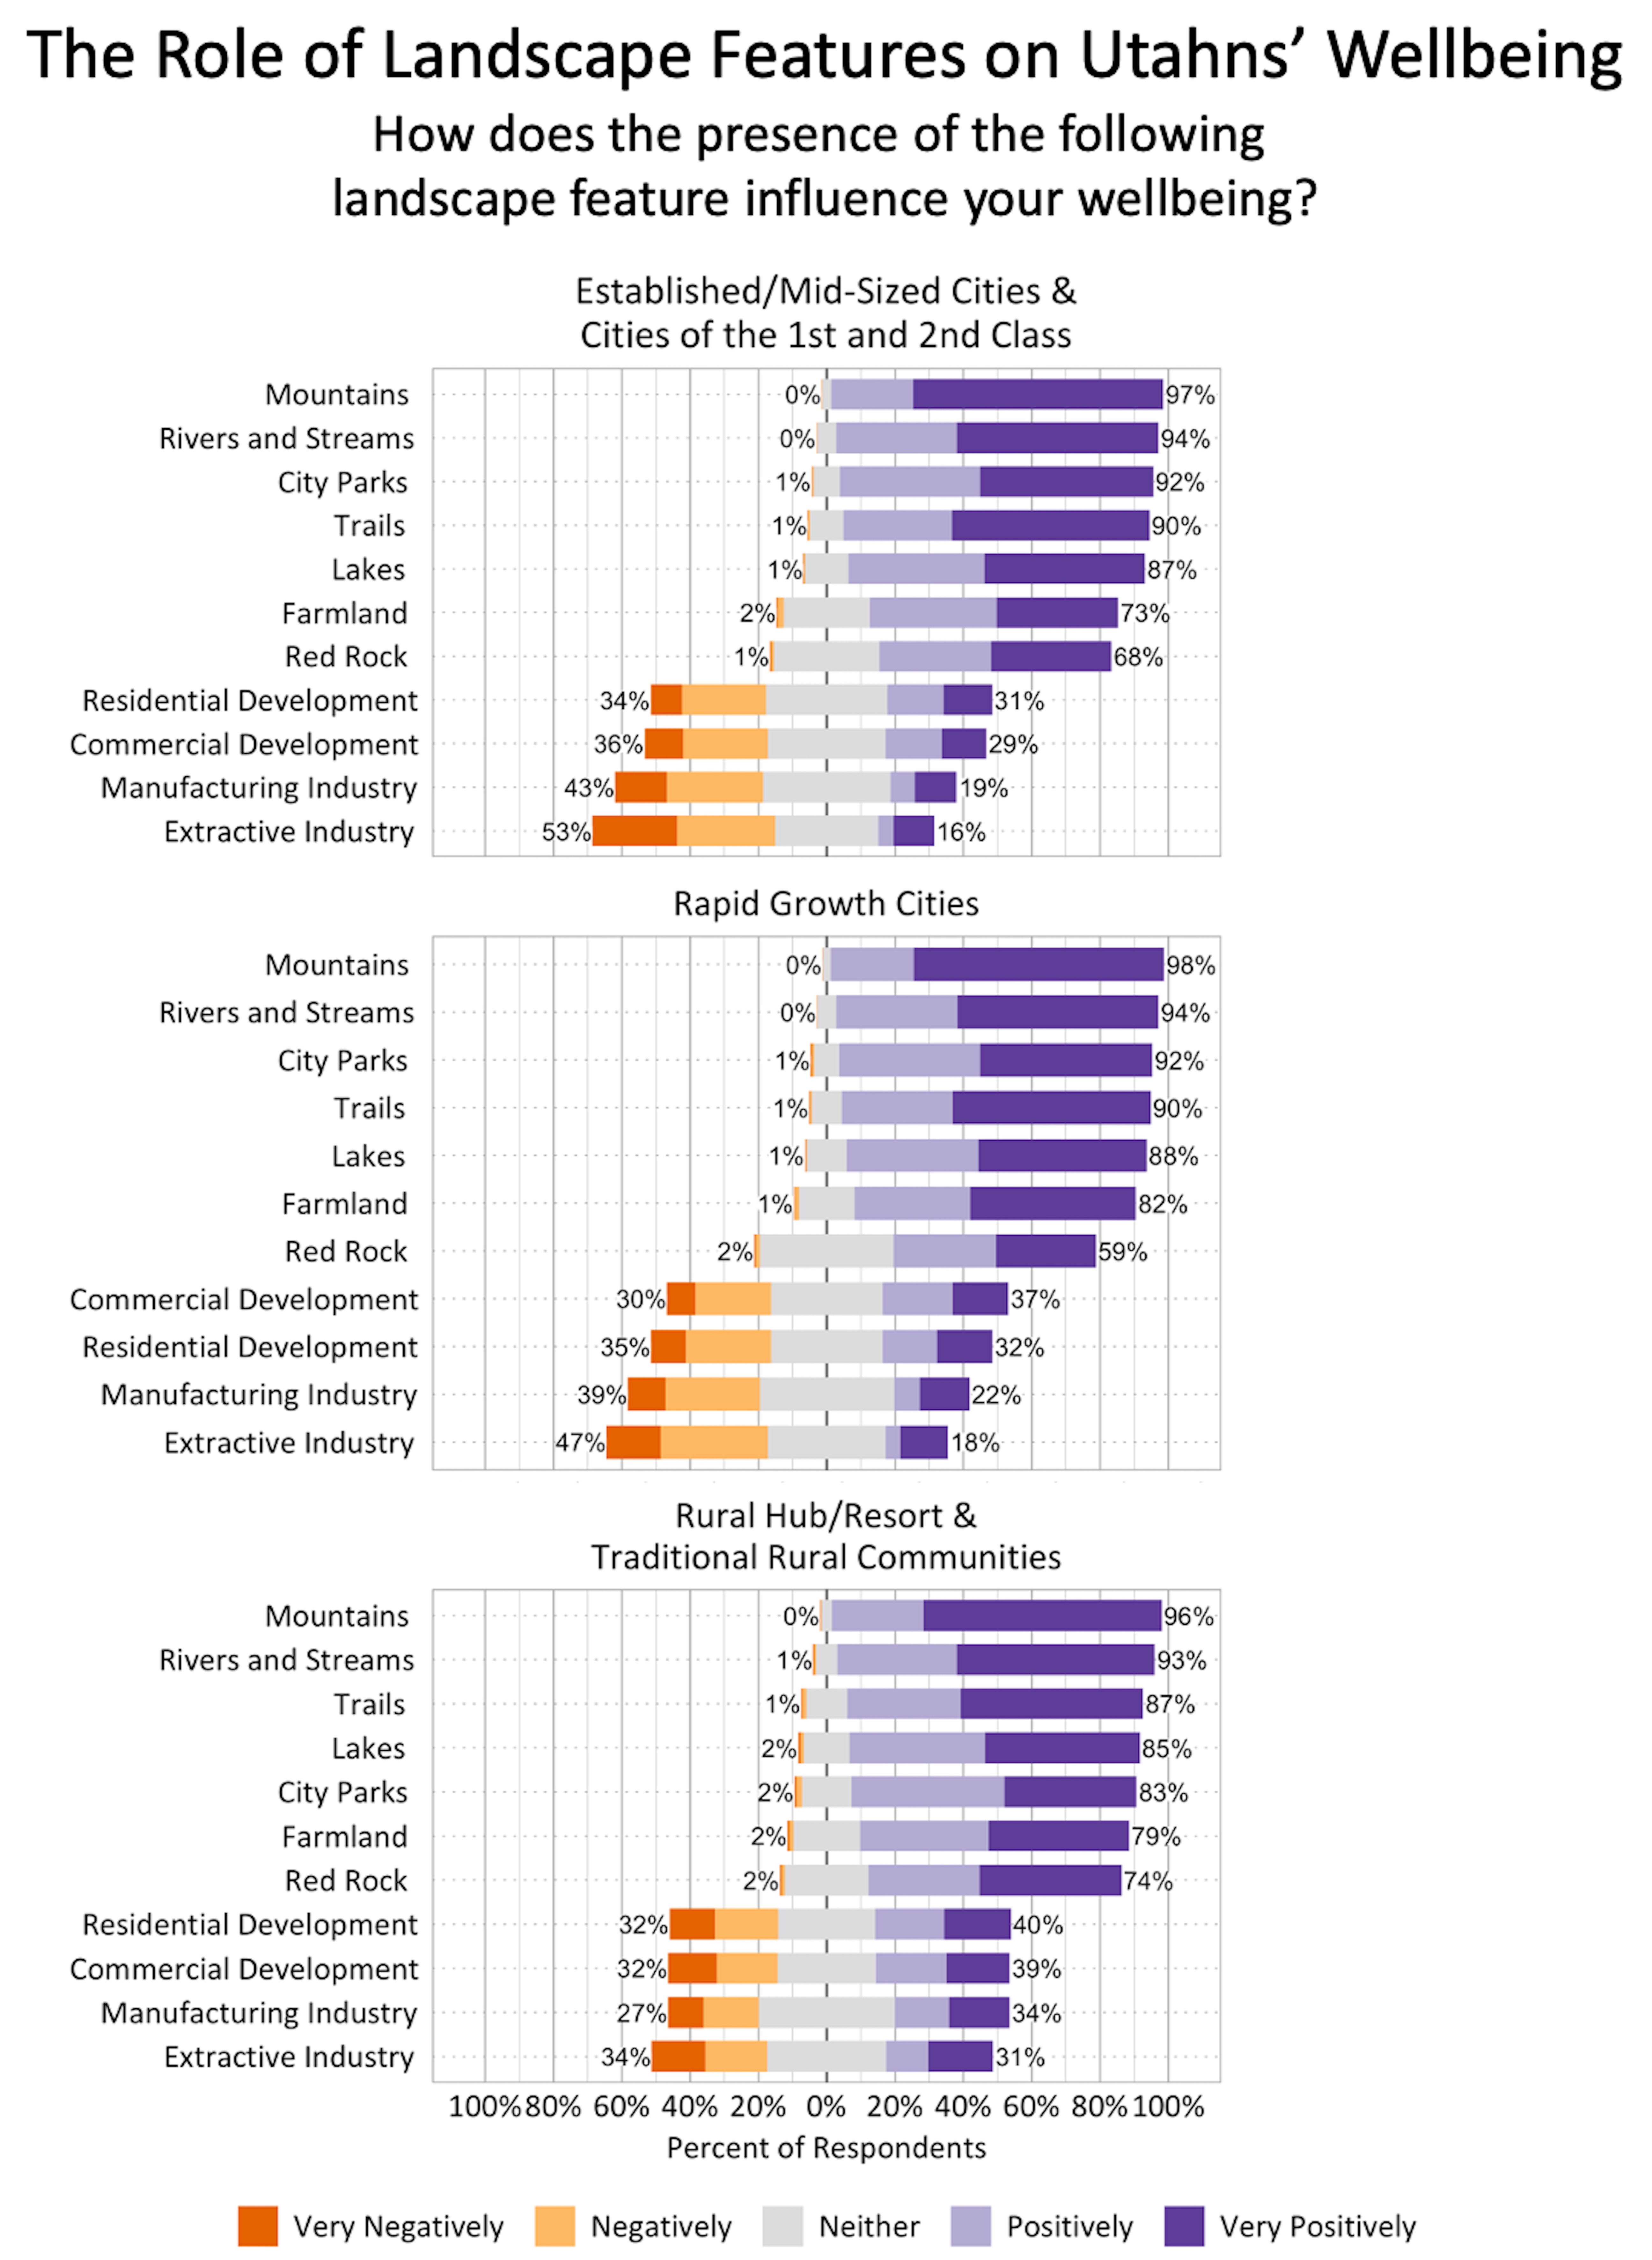
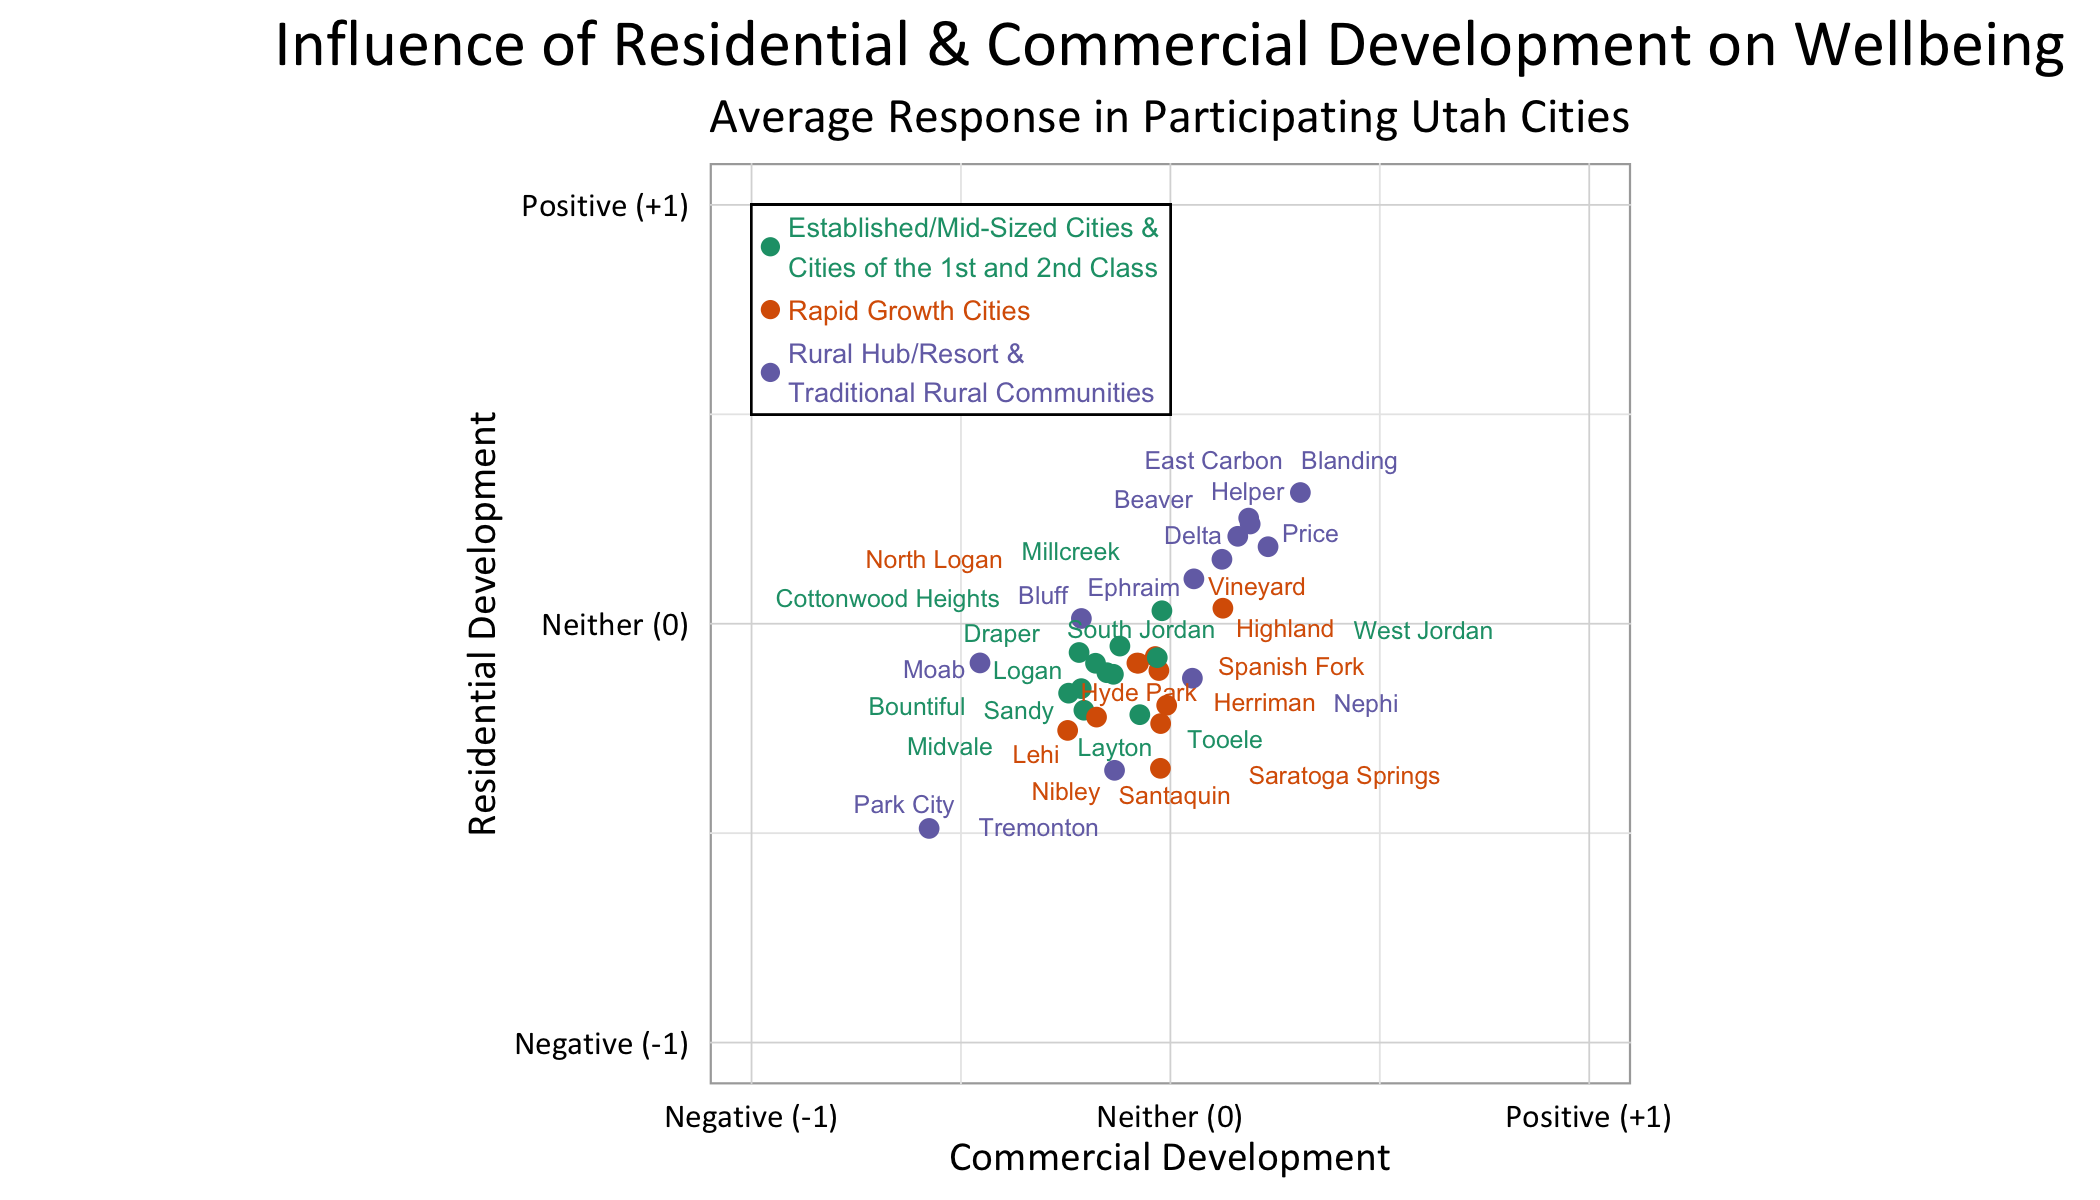
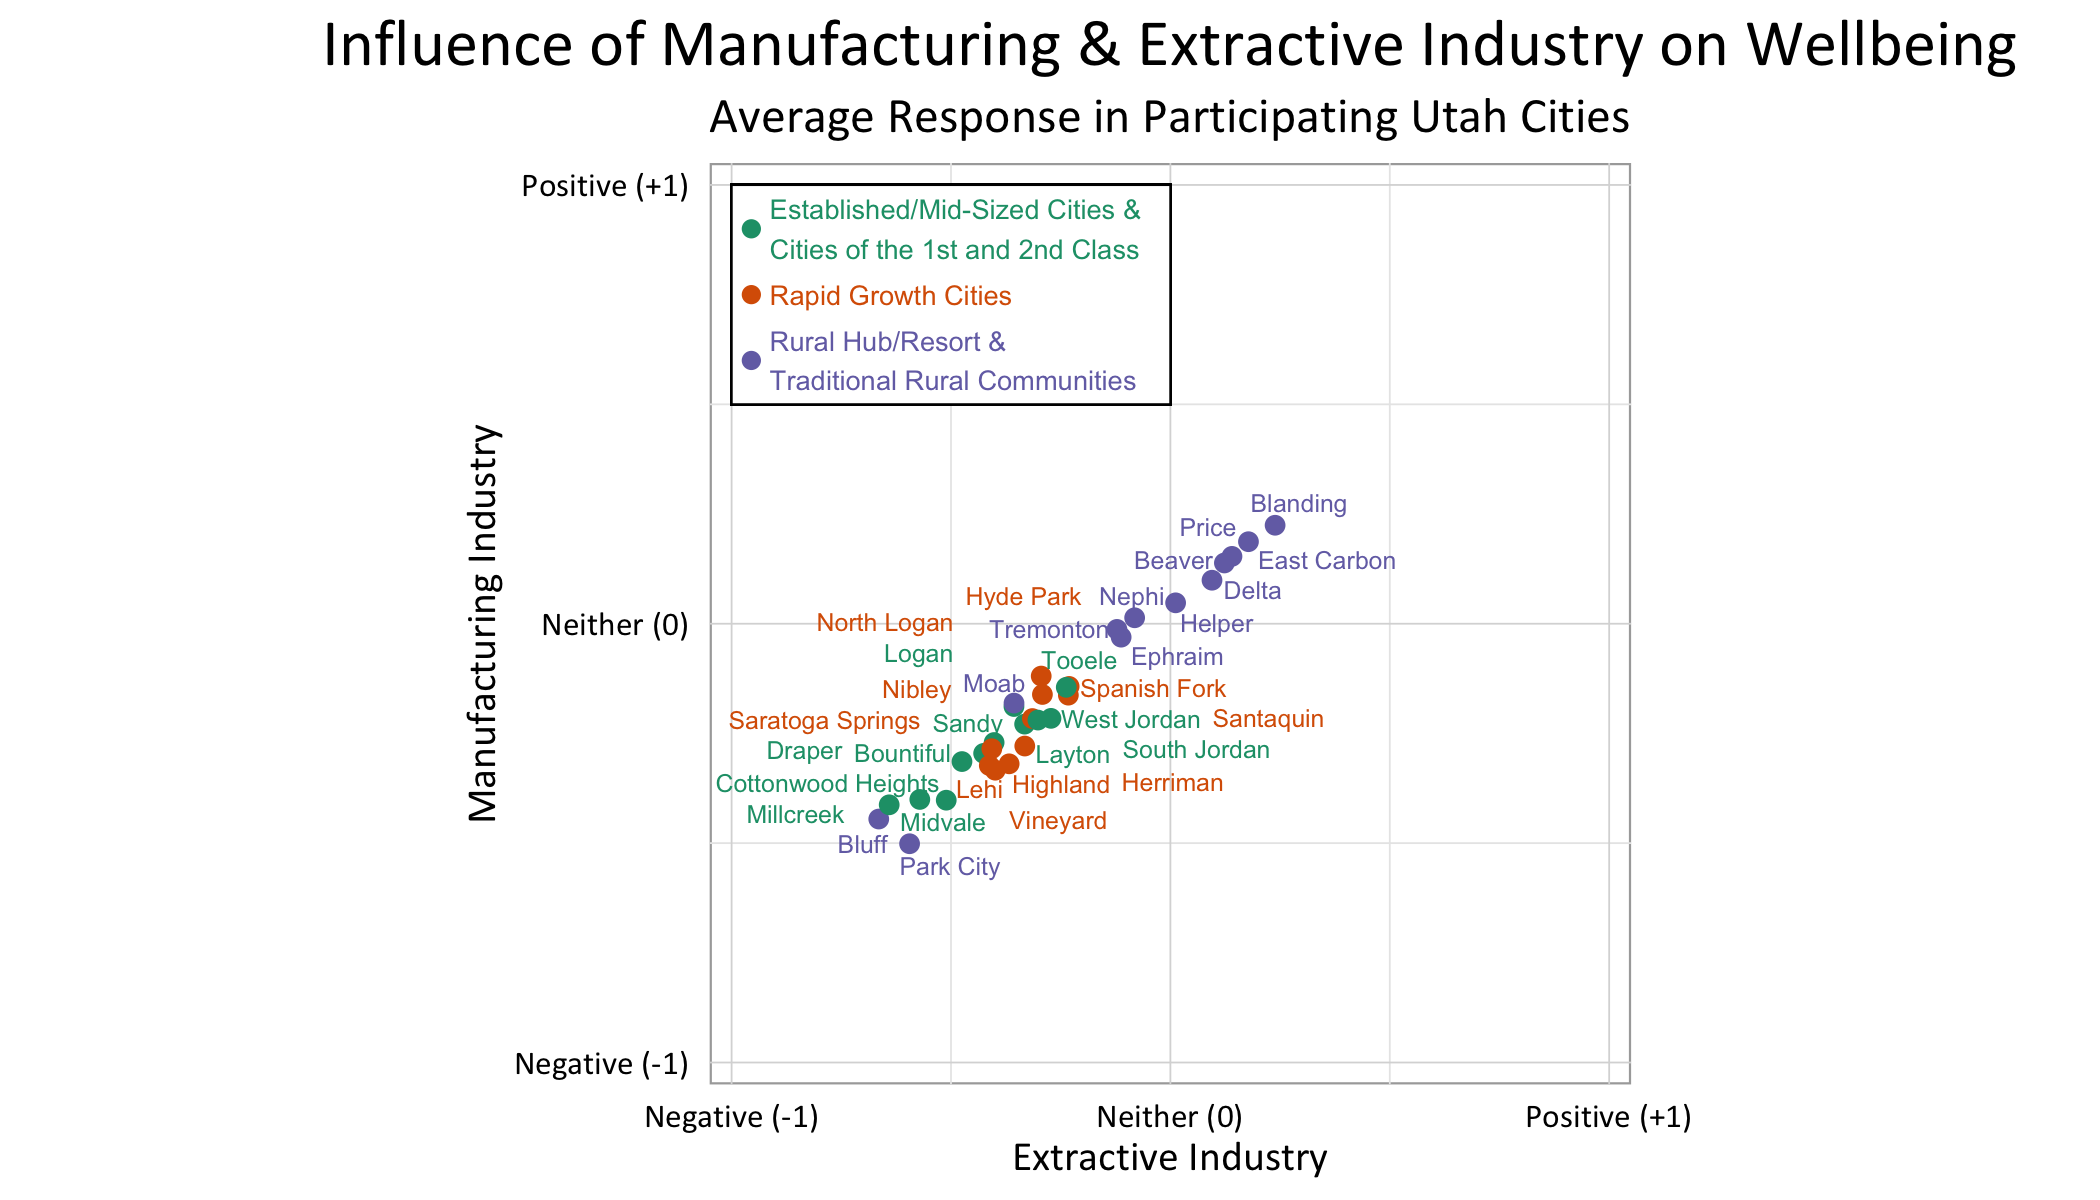
Development and Industry in the Landscape
The survey asked respondents to rate the influence of residential and commercial development and manufacturing and extractive industry in their landscape on their personal wellbeing. The graphs below shows that some rural communities were more positive about development and industry than their urban counterparts.
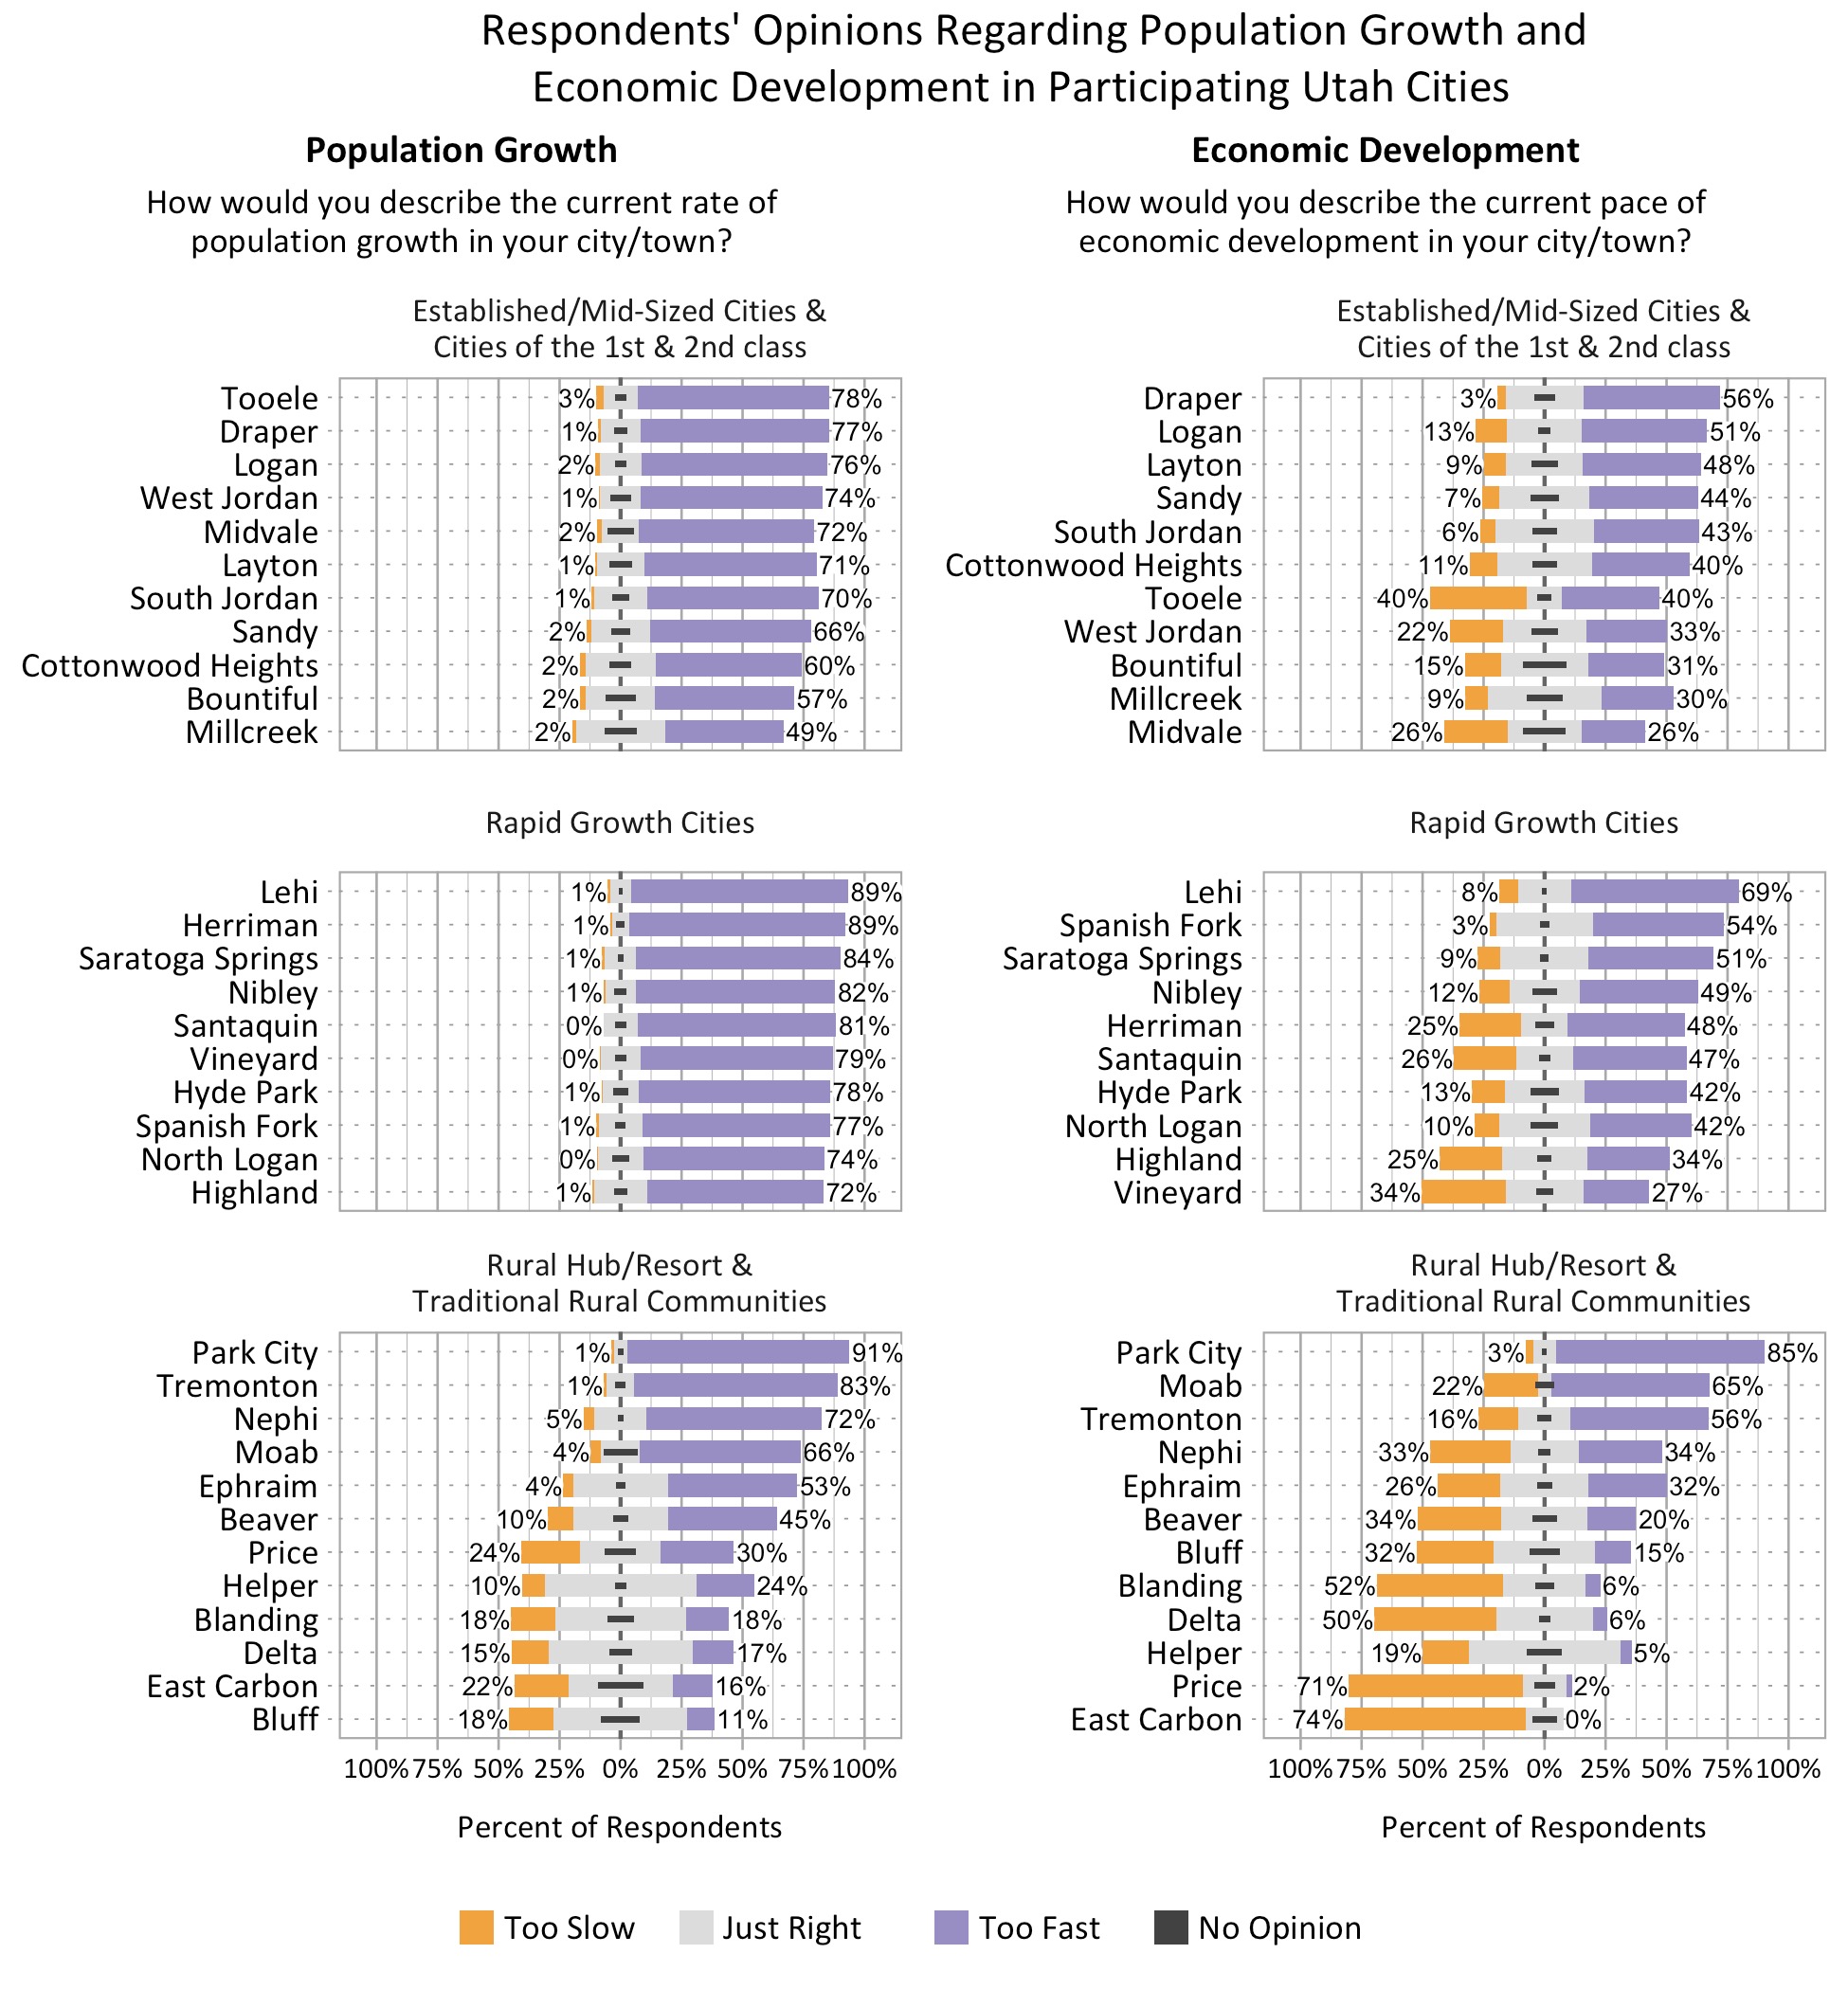
Perspectives on Population Growth and Economic Development
There were considerable differences in perspectives over population growth versus economic growth across the study cities. Respondents from all but the most rural cities felt population growth was too fast. There was more variation in perspectives on the pace of economic development.
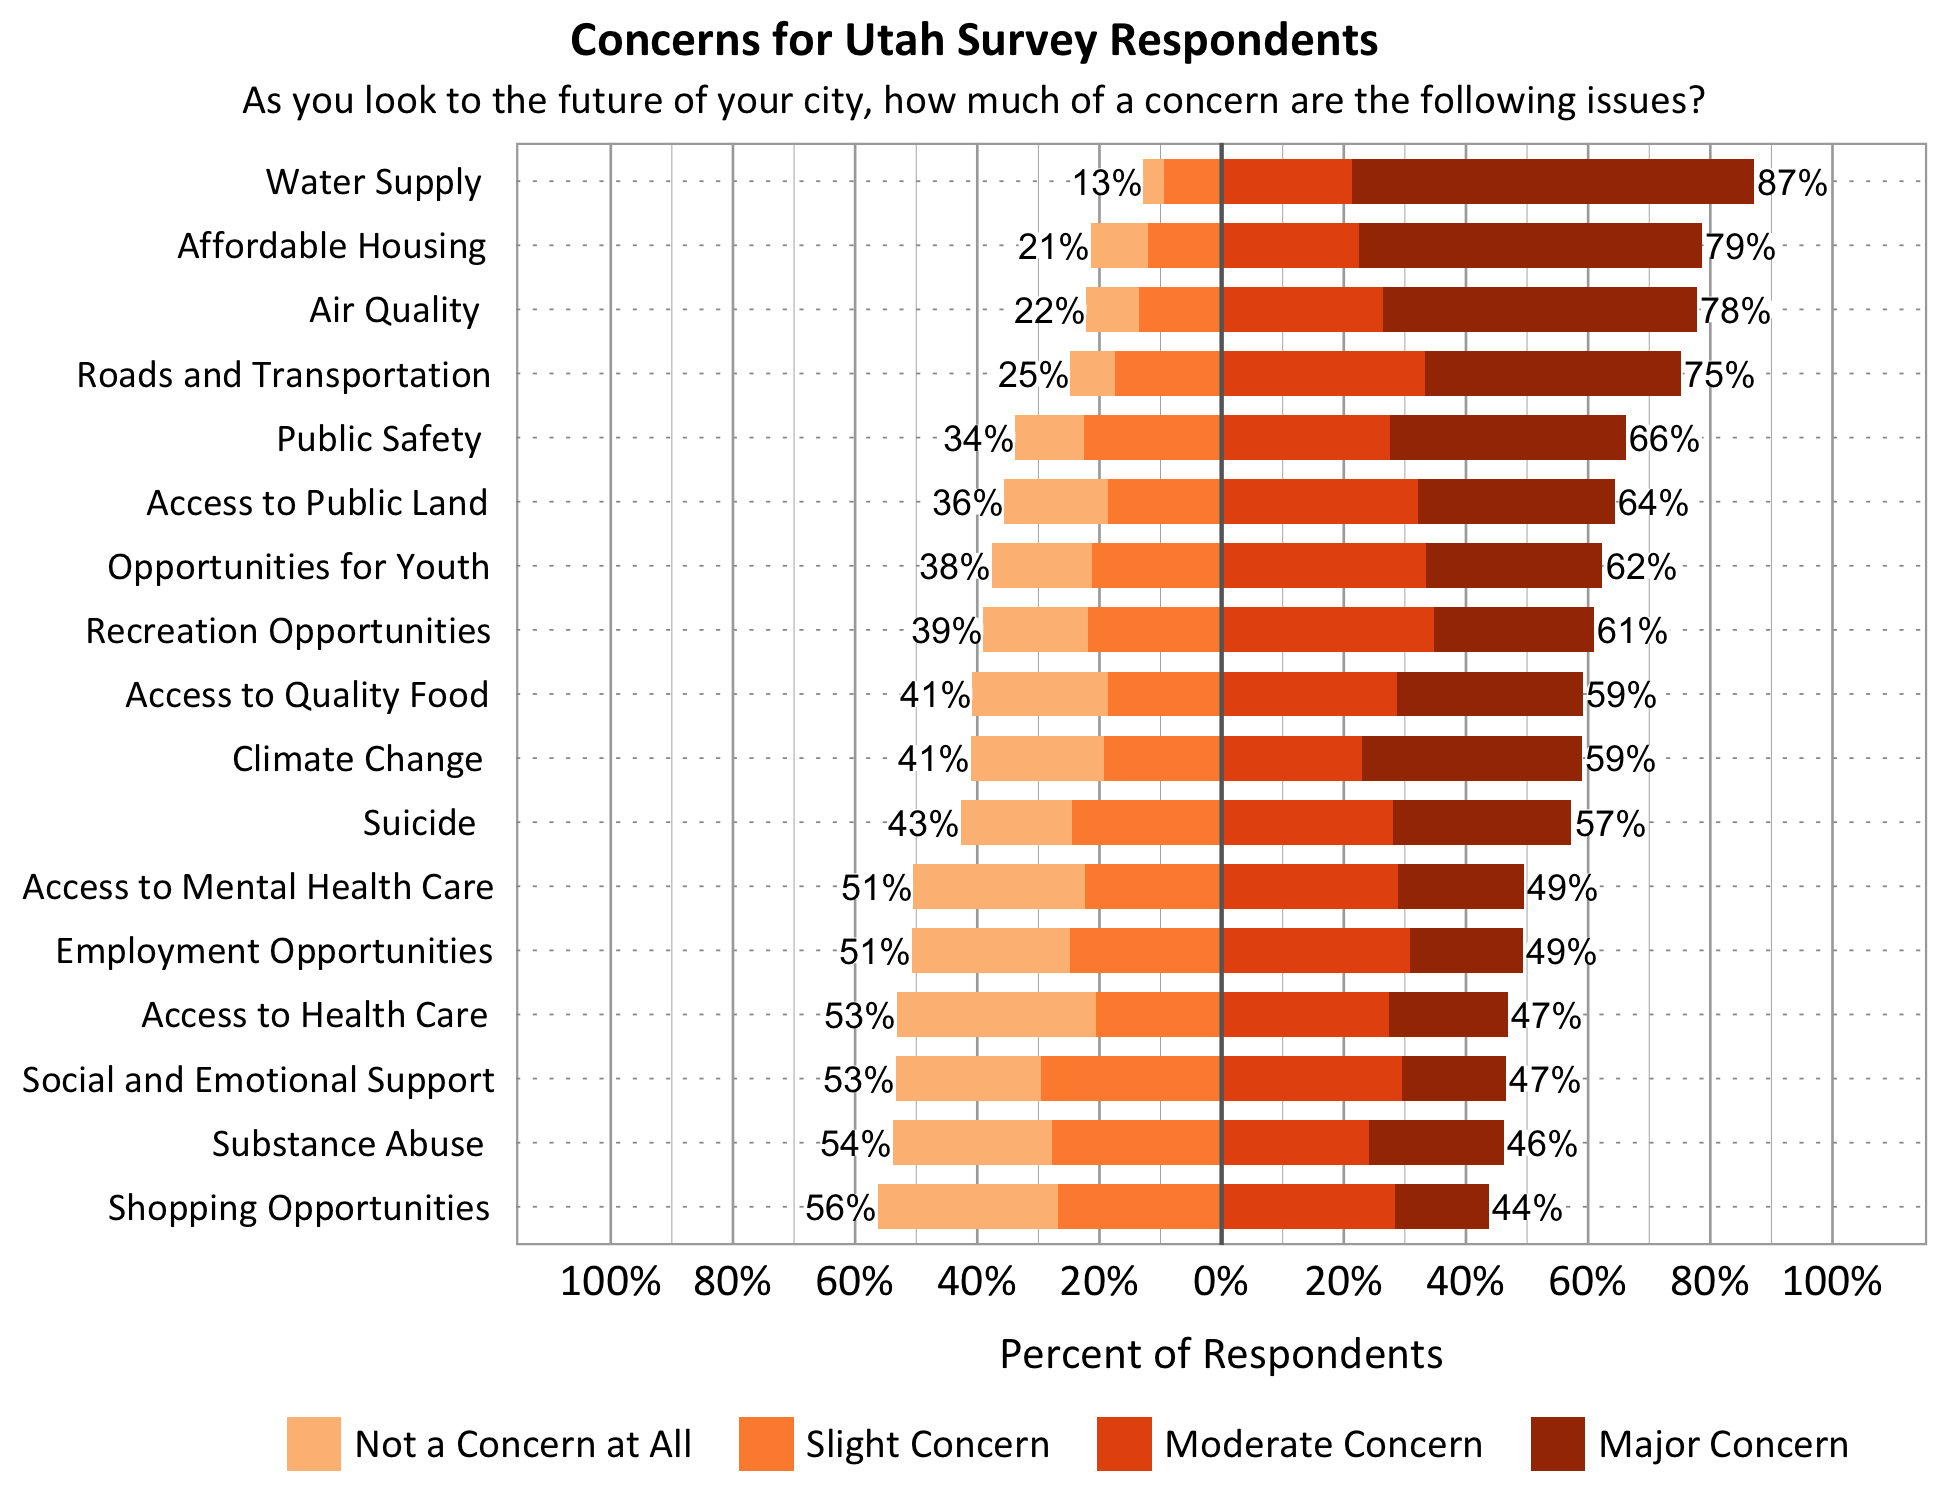
Concerns for the Future of Utah Cities
Top concerns varied across cities and clusters. Concerns for each city are found in their city report. Water Supply, Affordable Housing, and Roads and Transportation were in the top 4 concerns across all three city clusters. Air Quality was a top 3 concern for both Established Mid-Sized/Cities of the 1st and 2nd Class and Rapid Growth cities. For respondents from Rural cities, Opportunities for Youth were a top concern. The graph below shows the aggregate concerns for all 2022 respondents across Utah.