Cedar City Wellbeing Survey Findings
May 2020
Dr. Courtney Flint
Utah State University Extension

Summary
Cedar City is one of 25 cities participating in the Utah Wellbeing Project. This project is designed to assess the wellbeing and local perspectives of city residents and to provide information to city leaders to inform their general planning process.
Eighteen cities participated in an online survey effort in February and March 2020. The Cedar City mayor’s office and economic development office advertised the survey via social media and a newsletter. All city residents age 18 and over were encouraged to take the online Qualtrics survey, available from January 30, 2020 to March 8, 2020.
A total of 262 completed surveys were recorded during this effort. This report contains descriptive information based on Cedar City resident responses and comparisons with other cities from this most recent survey effort.
Public intercept surveys with iPads were also conducted in May 2019. A report based on those findings is available at https://usu.edu/utah-wellbeing-project/.
Respondent Characteristics
The vast majority of Cedar City survey respondents (96.9%) were full-time residents. Length of residency ranged from 0 to 70 years with an average of 8 years. The majority of respondents (70.9%) had been living in Cedar City more than 5 years. Regarding respondent zip code, 61.9% reported living in 84720 and 38.1% lived in 84721.
Table 1 details the demographic characteristics of the respondents and allows for comparison with U.S. Census information from the 2014-2018 American Community Survey. As the table shows, females and those age 60 and older were overrepresented in the survey sample. The survey underrepresents those without a college degree, those with incomes under $50,000 and those who are nonwhite or Latino. There is no census comparison for religion. These characteristics should be taken into consideration when interpreting the findings from the survey, as survey respondents are not fully representative of Cedar City residents.
Table 1
Demographic Characteristics of Survey Respondents and U.S. Census Data for Cedar City
| Demographic Characteristics | Cedar City iPad Survey 2019 (170 Respondents) | Cedar City Online Survey 2020 (262 Respondents) |
American Community Survey 2016-2020 Estimates |
|---|---|---|---|
| Age 18-39 | 51.4% | 26.7% | 57.1% |
| Age 40-59 | 26.1% | 35.6% | 23.0% |
| Age 60 or Over | 22.5% | 37.7% | 19.9% |
| Female | 60.9% | 66.7% | 49.9% |
| Male | 39.1% | 33.3% | 51.1% |
| No college degree | 57.1% | 43.2% | 66.3% |
| College degree (4-year) | 42.9% | 56.8% | 33.7% |
| Median household income | NA | NA | $52,524 |
| Income Under $50,000 | 46.4% | 28.3% | 48.4% |
| Income $50,000 to $74,999 | 25.0% | 28.8% | 20.1% |
| Income $75,000 to $99,999 | 14.9% | 16.4% | 13.3% |
| Income $100,000 to $149,999 | 8.9% | 15.9% | 13.0% |
| Income $150,000 or over | 4.8% | 10.6% | 5.2% |
| Religion: Church of Jesus Christ of Latter-day Saints |
54.8% | 47.2% | NA |
| Other religion | 24.2% | 26.2% | NA |
| No religious preference | 21.0% | 26.6% | NA |
| White (non-Latino) | 87.4% | 93.5% | 82.2% |
| Nonwhite or Latino | 12.6% | 6.5% | 17.8% |
| Children under 18 in household | NA | 37.1% | 39.4% |
| Employed (combined) | NA | 52.5% | 60.0% (in labor force age 16+) |
| Out of work and looking for work | NA | 1.7% | 3.5% (unemployed) |
| Retired | NA | 29.3% | NA |
| Other | NA | 16.5% | 36.5% (not in labor force) |
Overall Personal Wellbeing and Overall Wellbeing in Cedar City
Survey participants were asked about their overall personal wellbeing and overall community wellbeing in Cedar City. These wellbeing indicators are both measured on a 5-point scale from very poor (1) to excellent (5). The average personal wellbeing score in Cedar City was 3.99, with 78% of respondents indicating their wellbeing at a 4 or 5 on the 5-point scale. The average score for community wellbeing in Cedar City was 3.56.


The average personal wellbeing score in Cedar City falls below the average of all cities surveyed in early 2020. The Utah League of Cities and Towns classifies Cedar City in the “Established/Mid-Sized City” group, along with three other cities in this study (Bountiful, Draper, and Tooele). Of these cities, the score in Cedar City is statistically higher than that of Tooele and is statistically lower than that of Draper, but is not statistically significantly different from Bountiful.

Wellbeing Domains in Cedar City
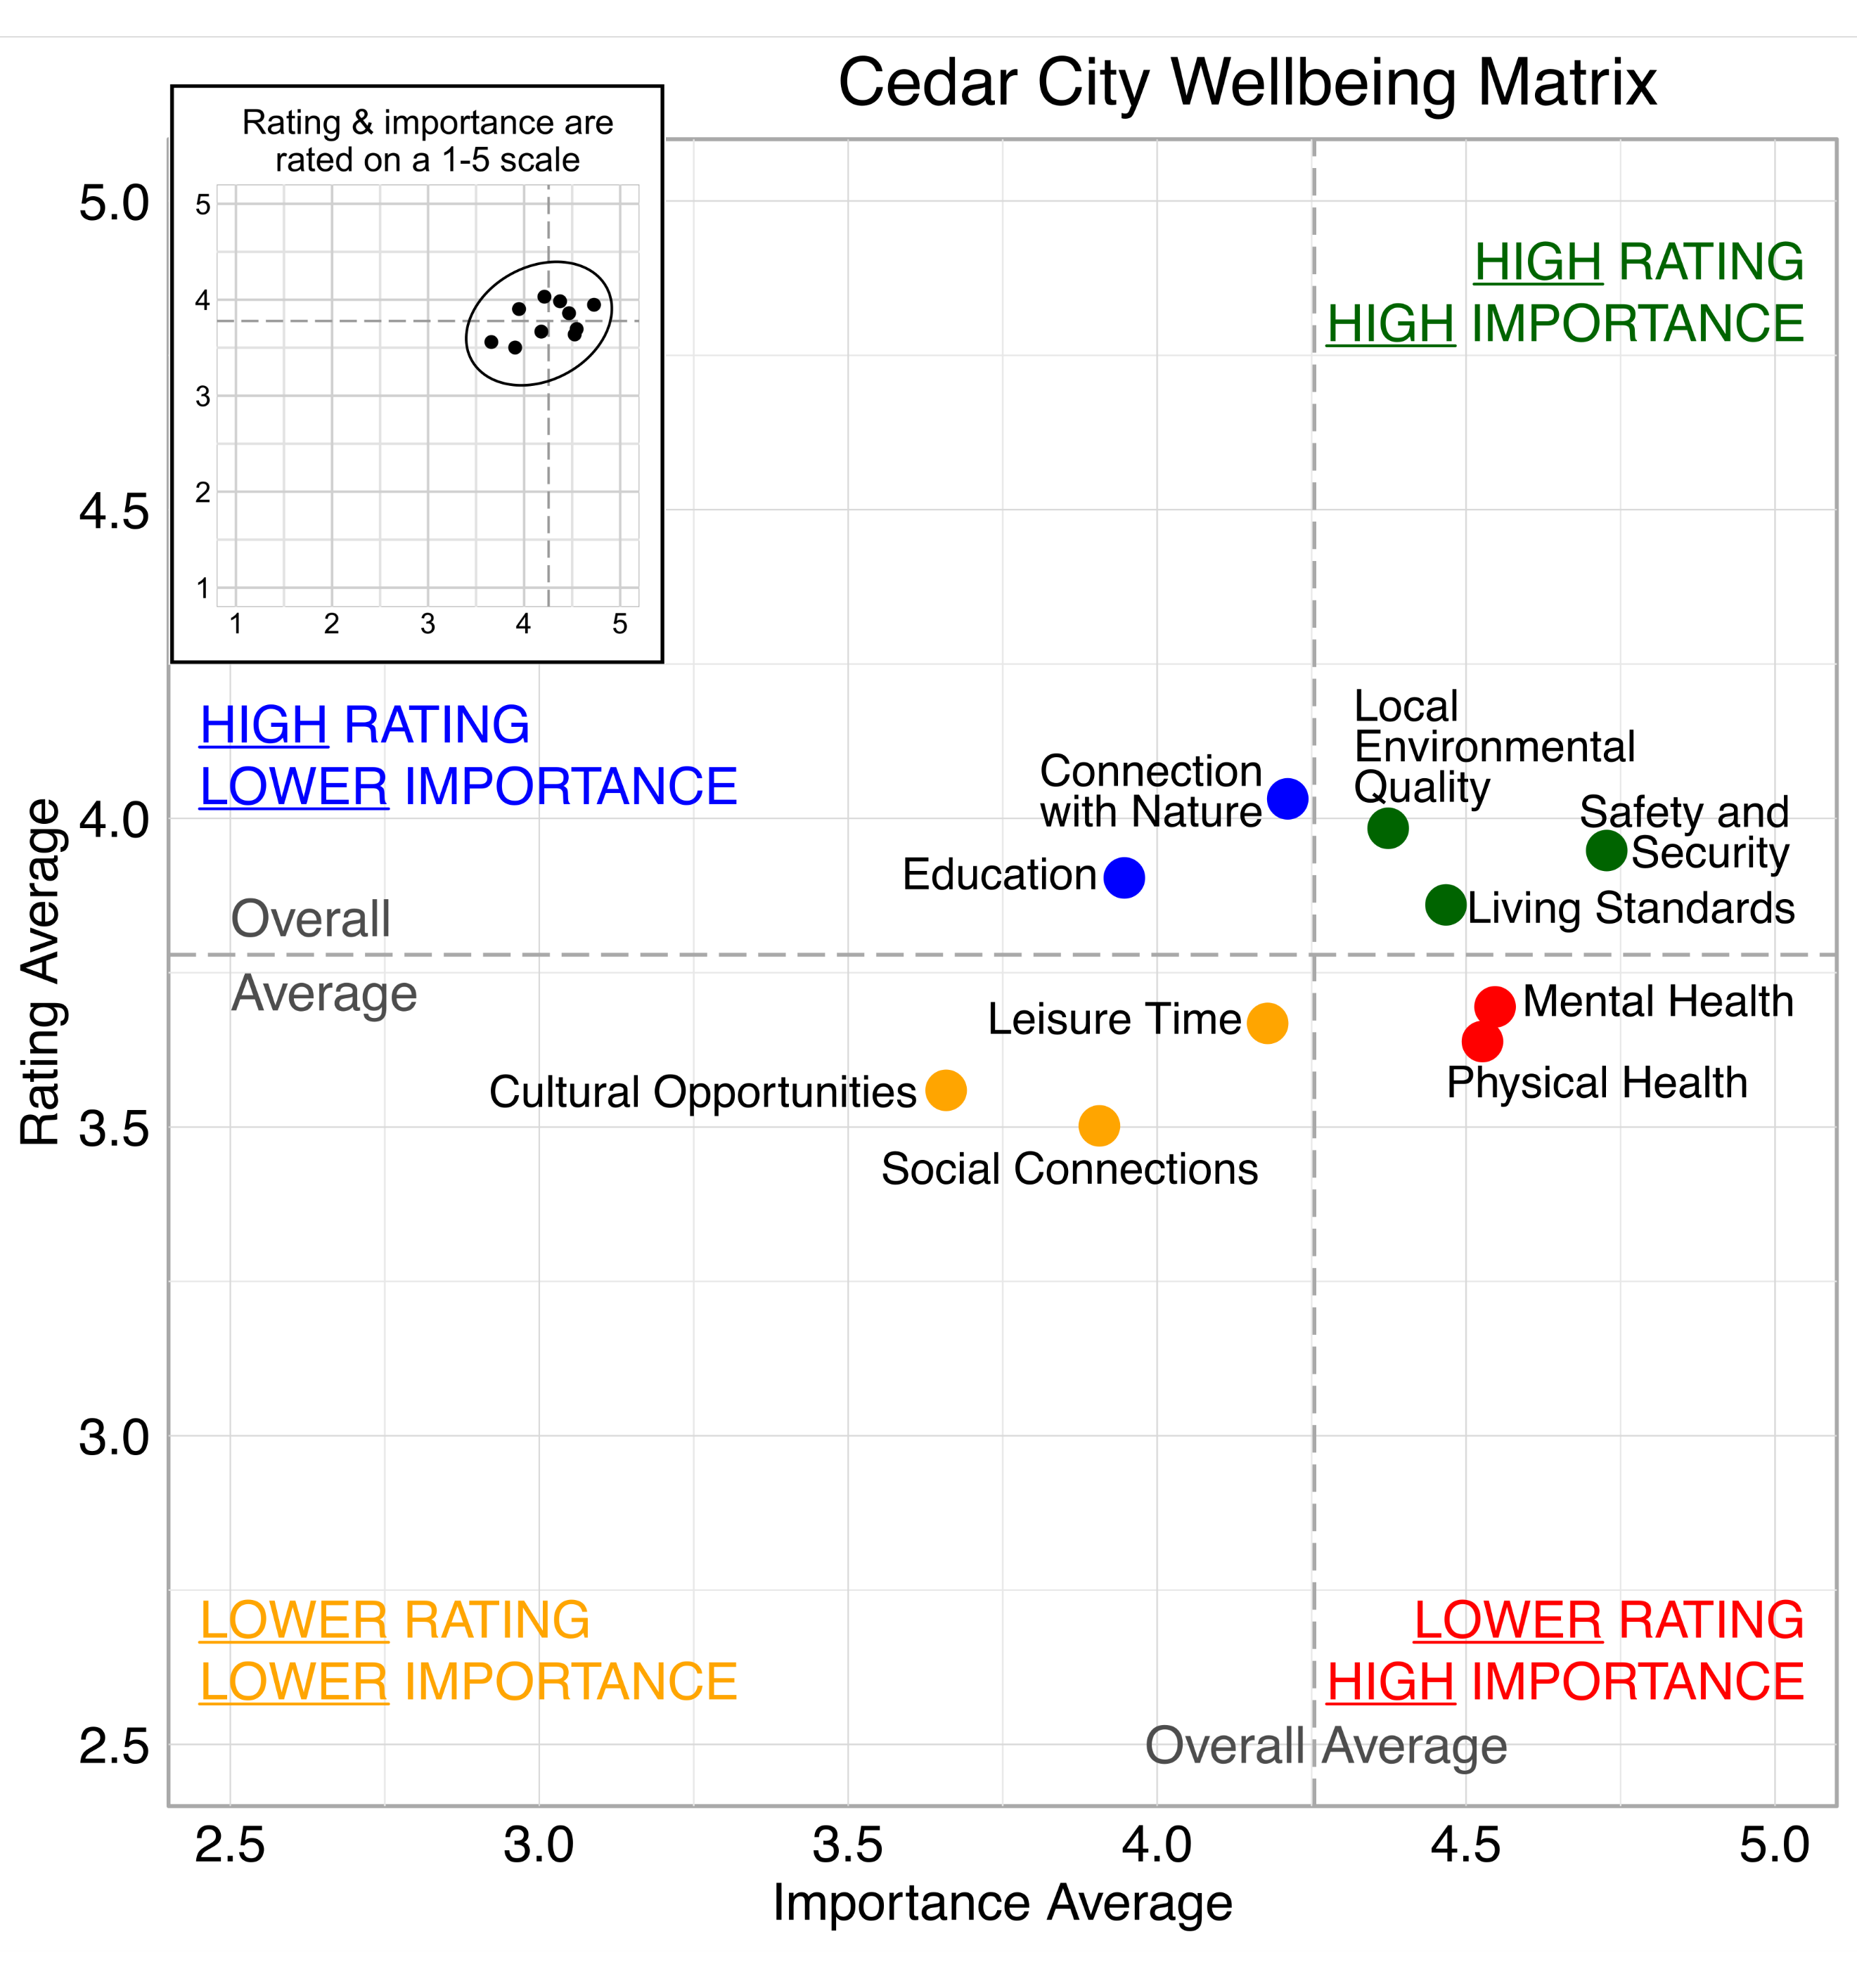
According to national and international entities tracking wellbeing, a number of common domains make up wellbeing. In this survey, respondents rated ten domains on a 5-point scale from poor to excellent, and indicated their importance to their overall personal wellbeing on a 5-point scale from not at all important to very important. Based on percentage with a good or excellent rating, the top three highest rated wellbeing domains for respondents were local environmental quality, connection with nature, and safety and security. The top three most important wellbeing domains were safety and security, living standards, and physical and mental health.


The demographic variables for age, gender college degree, religion, income, and zip code were significantly related to various wellbeing perspectives among Cedar City respondents. These relationships are shown in Table 2 below and are based on a multivariate generalized linear model using the categories from Table 1, excluding children in household and employment. Race/ethnicity was not found to play a significant role, but this could be due to sample size.
Table 2
Relationship Between Demographic Characteristics and Wellbeing Domains
| Domains Rated | Demographic Variables | ||||||
|---|---|---|---|---|---|---|---|
| Age 60+ | Female | College Degree | Latter-day Saint | Higher Income | Nonwhite or Latino | Zip Code | |
| Wellbeing Ratings | |||||||
| Overall Personal Wellbeing | + |
+ vs no religious preference |
+ $150,000+ > under $50,000 |
||||
| Wellbeing in Cedar City | + vs 40-59 |
+ vs no religious preference |
84720 > 84721 | ||||
| Connection to Nature | – vs other religion |
||||||
| Cultural Opportunities | + vs 18-39 |
||||||
| Education | + vs 40-59 |
+ | |||||
| Leisure Time | + | ||||||
| Living Standards | + | + $150,000+ > under $50,00 |
|||||
| Local Environmental Quality | + vs no religious preference |
+ $150,000+ > under $50,000 |
|||||
| Mental Health | + | ||||||
| Physical Health | – |
||||||
| Safety & Security | + vs 40-59 |
- vs no religious preference and other religion |
|||||
| Social Connections | + vs no religious preference |
||||||
| Age 60+ | Female | College Degree | Latter-day Saint | Higher Income | Nonwhite or Latino | Zip Code | |
| Domain Importance | |||||||
| Connection to Nature | + vs 18-39 |
+ | - vs no religious preference and other religion |
||||
| Cultural Opportunities | + | ||||||
| Education | + | ||||||
| Leisure Time | + | + | – vs other religion |
+ $150,000+ > under $50,000 |
|||
| Living Standards | |||||||
| Local Environmental Quality | + vs 40-59 |
- vs no religious preference |
|||||
| Mental Health | + vs 40-59 |
+ | |||||
| Physical Health | + vs 18-39 |
- vs no religious preference |
|||||
| Safety and Security | |||||||
| Social Connections | + | - vs no religious preference |
|||||
Wellbeing Matrix for Cedar City
The graph below illustrates the relationship between the average rating and the average importance of wellbeing domains for survey respondents from Cedar City. Mental Health and Physical Health fall into the red quadrant, indicating that they were of higher than average importance but rated lower than average. It is important to note that all domains have an average rating above 3.0 (moderate) and the importance score for all domains is higher than 3.0 (moderately important).
Community Action & Connections in Cedar City
Survey participants were asked about community actions and connectedness to community in Cedar City. Both questions were scored on a 5-point scale from not at all (1) to a great deal (5). When asked about the degree to which people take action together in response to local problems or opportunities in Cedar City, the average score was 3.37. When asked about the degree they feel connected to their community, the average score was 3.14.


In terms of demographic characteristics, age, religion, and income played significant roles in responses to community questions as shown in Table 3. These findings are based on a multivariate generalized linear model. Additionally, there was a significant, positive relationship between individuals’ community connectedness and their overall personal wellbeing.
Table 3
Demographic Characteristics and Community Questions
| Community Questions | Age 60+ | Female | College Degree | Latter-day Saint | Higher Income | Nonwhite or Latino |
|---|---|---|---|---|---|---|
| Do people in Cedar City take action? | + vs 40-59 |
+ vs no religion preference |
||||
| Do you feel connected to your community? | + |
+ |

Influence of Landscape on Wellbeing
Survey participants were asked about the influence of landscape features on their wellbeing. Natural landscape including mountains, rivers and streams, red rock, and lakes, as well as trails and city parks, were found to have an overwhelmingly positive influence on wellbeing. Farmland also had a positive influence for the vast majority of survey respondents.
In terms of development and industry in the landscape, just over one-third of survey respondents indicated that extractive industry had a negative influence on their wellbeing. On the other hand, respondents indicated more positive than negative perceptions of commercial development, residential development, and manufacturing industry.

Perspectives on Population Growth and Economic Development in Cedar City
Survey respondents were split on their thoughts about population growth in Cedar City, with 46% saying it’s too fast and 43% saying it's just right. Regarding pace of economic development in Cedar City, 44% said it is too slow and 39% said it is just right. Compared to other cities surveyed in early 2020, Cedar City had a relatively small percentage of respondents indicate that population growth is too fast and a relatively small percentage indicate that economic development is too slow.


Risks and Assets for Wellbeing in Cedar City
Survey respondents indicated the degree to which a number of local issues were a major or minor risk or asset to wellbeing in Cedar City (see Table 4).
Table 4
Top Rated Risks and Assets by Cedar City Respondents
| Highest Rated Assets (indicated by at least 80% of respondents) |
Highest Rated Risks (Indicated by at least 20% of respondents) |
| Air Quality | Substance Abuse |
| Access to Public Land | Employment Opportunities |
| Recreation Opportunities | Electronic Devices |
| Public Safety | |
| Access to Quality Food |
Respondents also wrote in other assets and risks as shown in Table 5. It is clear that some people not only listed current assets, but also those they wish Cedar City had.
Table 5
Other Assets and Risks Mentioned by Cedar City Respondents
| Other Assets | Other Risks | ||
|---|---|---|---|
| Access to quality and affordable education, SUU and USF (3) | Good sidewalks/walkable town/trails (4) | Lack of diversity/Religious discrimination/LDS domination/Racism (7) | Overbuilding, development, rapid growth (4) |
| Activities, outdoor adult exercise park, senior friendly (2) | Animals/Dogs (2) | Cost of living/Decent paying jobs/Wage stagnation (4) | Traffic (2) |
| Aging medical services | Infrastructure | Cleanliness of city/neighborhood trash (2) | Homelessness (2) |
| Living wage | More traffic lights | Aging services | Drugs |
| New roads | Pay increase for city employees | Inconsiderate/unsafe drivers | Liminted airport destinations |
| Zoning violations | Noise | Owning guns | |
| Over regulation, zoning | Politicians | ||
| Suicide | |||
Summary of Open Comments
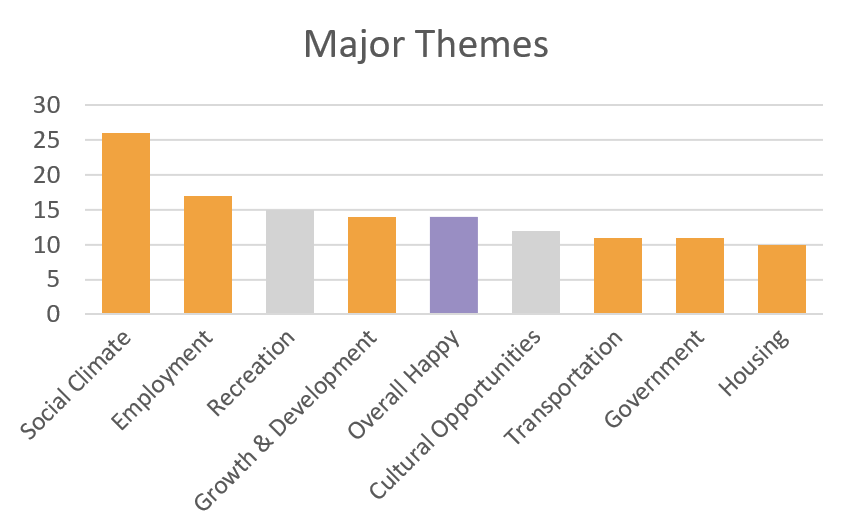
Respondents were given the opportunity to provide comments at the end of the survey. Comments were made by 99 Cedar City respondents (38% of those that completed the survey). Cedar City residents are concerned about a wide variety of issues. Many people expressed frustration with the lack of high-paying jobs in the area and the high cost of living relative to wages. Additionally, some Cedar City resident shared the sentiment that Cedar City is growing faster than existing infrastructure can keep up with. Others feel that they are unable to find community and connection due to the social climate in the city. Other concerns mentioned in comments include issues relating to traffic, healthcare, spending, and cultural opportunities. However, many people appreciate the outdoor recreation offered and love living in Cedar City.
Dominant themes in comments included the following:
- Presence of a hostile social climate
- Low wage and high cost of living
- Lack of employment opportunities
- Growing too fast
- Many people love Cedar City
A Few Quotes:
- “I worry that my children won’t be able to afford to live in Cedar City. Housing prices are too high and wages are too low.”
- "It is very difficult to find a place to belong or a sense of community in Cedar City without being Mormon.”
- “Cedar City is a friendly and caring small city. I would like to see it stay that way, but I realize that Cedar City will get larger and as it grows there will be growing pains. It is my hope that we will be able to retain the caring and friendly attitude as we grow.”
- “I love living in this city and believe our walking trails are our greatest asset for helping the overall physical and mental well-being of people in this community.”